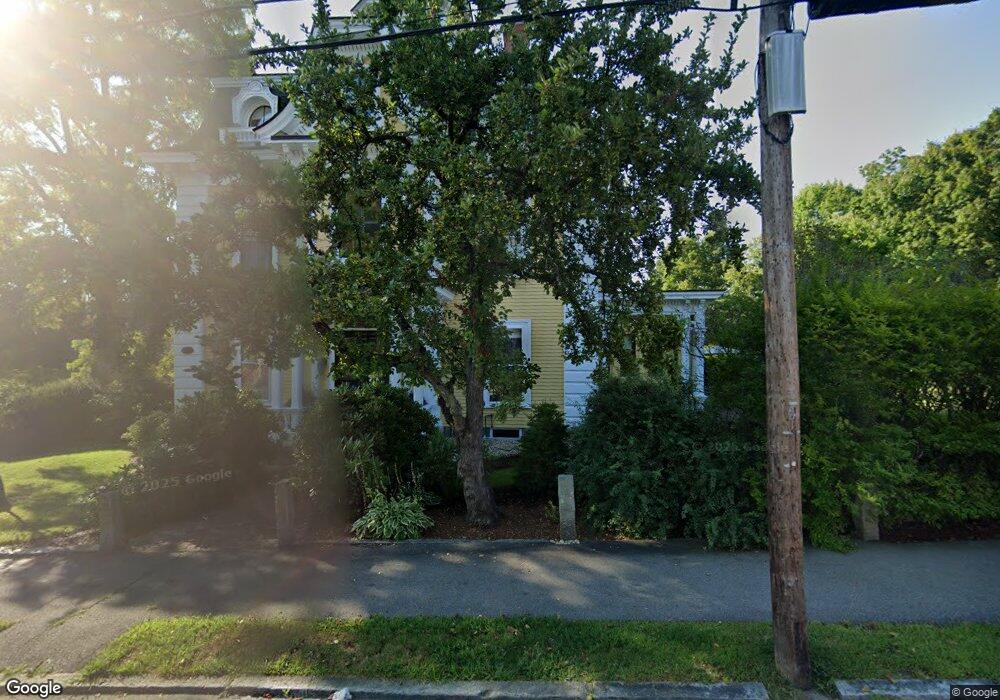
73 Warren St Unit 2 Concord, NH 03301
North End NeighborhoodEstimated Value: $421,659 - $537,000
1
Bed
2
Baths
1,588
Sq Ft
$297/Sq Ft
Est. Value
About This Home
This home is located at 73 Warren St Unit 2, Concord, NH 03301 and is currently estimated at $472,165, approximately $297 per square foot. 73 Warren St Unit 2 is a home located in Merrimack County with nearby schools including Christa McAuliffe School, Rundlett Middle School, and Concord High School.
Ownership History
Date
Name
Owned For
Owner Type
Purchase Details
Closed on
Dec 23, 2021
Sold by
Jill K Blackmer T
Bought by
Arpiar G Saunders Jr T
Current Estimated Value
Purchase Details
Closed on
Sep 12, 2018
Sold by
Judith P Bilodeau Ret
Bought by
Jill K Blackmer T
Purchase Details
Closed on
Dec 27, 2011
Sold by
Bentley Vivian T
Bought by
M E & J P Bilodeau Ret and Bilodeau Judith P
Home Financials for this Owner
Home Financials are based on the most recent Mortgage that was taken out on this home.
Original Mortgage
$120,000
Interest Rate
3.99%
Mortgage Type
Purchase Money Mortgage
Purchase Details
Closed on
Jan 26, 2007
Sold by
Kennedy Christine
Bought by
Bentley Vivian T
Home Financials for this Owner
Home Financials are based on the most recent Mortgage that was taken out on this home.
Original Mortgage
$240,000
Interest Rate
6.15%
Mortgage Type
Purchase Money Mortgage
Purchase Details
Closed on
Oct 31, 2000
Sold by
Sturm Julia
Bought by
Weller Patricia Joyce
Create a Home Valuation Report for This Property
The Home Valuation Report is an in-depth analysis detailing your home's value as well as a comparison with similar homes in the area
Home Values in the Area
Average Home Value in this Area
Purchase History
| Date | Buyer | Sale Price | Title Company |
|---|---|---|---|
| Arpiar G Saunders Jr T | -- | None Available | |
| Jill K Blackmer T | $310,000 | -- | |
| M E & J P Bilodeau Ret | $222,000 | -- | |
| Bentley Vivian T | $300,000 | -- | |
| Weller Patricia Joyce | $199,500 | -- |
Source: Public Records
Mortgage History
| Date | Status | Borrower | Loan Amount |
|---|---|---|---|
| Previous Owner | Weller Patricia Joyce | $120,000 | |
| Previous Owner | Weller Patricia Joyce | $240,000 |
Source: Public Records
Tax History Compared to Growth
Tax History
| Year | Tax Paid | Tax Assessment Tax Assessment Total Assessment is a certain percentage of the fair market value that is determined by local assessors to be the total taxable value of land and additions on the property. | Land | Improvement |
|---|---|---|---|---|
| 2024 | $9,500 | $343,100 | $0 | $343,100 |
| 2023 | $9,216 | $343,100 | $0 | $343,100 |
| 2022 | $8,883 | $343,100 | $0 | $343,100 |
| 2021 | $8,606 | $342,600 | $0 | $342,600 |
| 2020 | $8,577 | $320,500 | $0 | $320,500 |
| 2019 | $8,056 | $290,000 | $0 | $290,000 |
| 2018 | $6,683 | $271,900 | $0 | $271,900 |
| 2017 | $6,628 | $234,700 | $0 | $234,700 |
| 2016 | $6,408 | $231,600 | $0 | $231,600 |
| 2015 | $7,089 | $259,300 | $0 | $259,300 |
| 2014 | $6,952 | $259,300 | $0 | $259,300 |
| 2013 | $6,633 | $259,300 | $0 | $259,300 |
| 2012 | $5,442 | $223,300 | $0 | $223,300 |
Source: Public Records
Map
Nearby Homes
- 73 Warren St Unit 1
- 73 Warren St Unit 4
- 92 Warren St
- 94 Warren St Unit 96
- 71 Warren St
- 90 Warren St
- 2 Tahanto St
- 16 Merrimack St Unit 18
- 16 Merrimack St
- 17 Merrimack St
- 69 Warren St
- 17 1/2 Merrimack St
- 9 Merrimack St
- 12 Merrimack St Unit 14
- 46 Tahanto St
- 79 Warren St
- 4 Orchard St
- 26 Merrimack St
- 5 Huntington St
- 104 Warren St