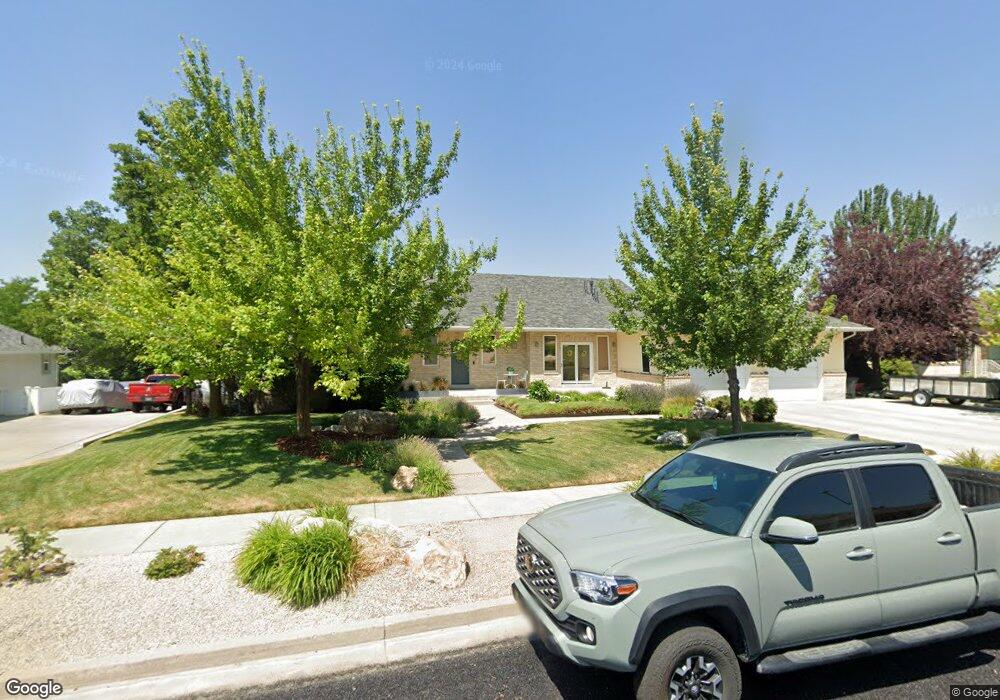
73 Winding Way Logan, UT 84321
Wilson NeighborhoodEstimated Value: $736,571 - $860,000
5
Beds
4
Baths
5,168
Sq Ft
$153/Sq Ft
Est. Value
About This Home
This home is located at 73 Winding Way, Logan, UT 84321 and is currently estimated at $790,893, approximately $153 per square foot. 73 Winding Way is a home located in Cache County with nearby schools including Wilson School, Mount Logan Middle School, and Logan High School.
Ownership History
Date
Name
Owned For
Owner Type
Purchase Details
Closed on
Jul 15, 2025
Sold by
Wappett Matthew T and Wappett Lianne D
Bought by
Matthew Thomas Wappett And Lianne Daniels Wap and Wappett
Current Estimated Value
Purchase Details
Closed on
Aug 26, 2014
Sold by
Burr Bryan D
Bought by
Halaufia Brandon Havea and Halaufia Elizabeth Kay
Home Financials for this Owner
Home Financials are based on the most recent Mortgage that was taken out on this home.
Original Mortgage
$357,353
Interest Rate
4.11%
Mortgage Type
New Conventional
Purchase Details
Closed on
Nov 14, 2011
Sold by
Burr Gayle
Bought by
Burr Bryan D
Purchase Details
Closed on
Nov 18, 2009
Sold by
Burr Bryan D
Bought by
Burr Gayle
Purchase Details
Closed on
Mar 27, 2001
Sold by
Sattinger David H and Sattinger Irene
Bought by
Burr Bryan D
Home Financials for this Owner
Home Financials are based on the most recent Mortgage that was taken out on this home.
Original Mortgage
$387,600
Interest Rate
7.06%
Create a Home Valuation Report for This Property
The Home Valuation Report is an in-depth analysis detailing your home's value as well as a comparison with similar homes in the area
Home Values in the Area
Average Home Value in this Area
Purchase History
| Date | Buyer | Sale Price | Title Company |
|---|---|---|---|
| Matthew Thomas Wappett And Lianne Daniels Wap | -- | None Listed On Document | |
| Matthew Thomas Wappett And Lianne Daniels Wap | -- | None Listed On Document | |
| Halaufia Brandon Havea | -- | United Title Services | |
| Burr Bryan D | -- | Hickman Land Title Company | |
| Burr Gayle | -- | Accommodation | |
| Burr Bryan D | -- | American Secure Title |
Source: Public Records
Mortgage History
| Date | Status | Borrower | Loan Amount |
|---|---|---|---|
| Previous Owner | Halaufia Brandon Havea | $357,353 | |
| Previous Owner | Burr Bryan D | $387,600 |
Source: Public Records
Tax History Compared to Growth
Tax History
| Year | Tax Paid | Tax Assessment Tax Assessment Total Assessment is a certain percentage of the fair market value that is determined by local assessors to be the total taxable value of land and additions on the property. | Land | Improvement |
|---|---|---|---|---|
| 2025 | $3,418 | $442,025 | $0 | $0 |
| 2024 | $3,412 | $427,390 | $0 | $0 |
| 2023 | $3,559 | $425,010 | $0 | $0 |
| 2022 | $3,812 | $425,005 | $0 | $0 |
| 2021 | $3,329 | $573,395 | $80,000 | $493,395 |
| 2020 | $3,126 | $484,674 | $80,000 | $404,674 |
| 2019 | $3,268 | $484,673 | $80,000 | $404,673 |
| 2018 | $3,189 | $431,890 | $80,000 | $351,890 |
| 2017 | $3,072 | $219,945 | $0 | $0 |
| 2016 | $3,185 | $214,445 | $0 | $0 |
| 2015 | $2,937 | $202,600 | $0 | $0 |
| 2014 | $2,655 | $202,600 | $0 | $0 |
| 2013 | -- | $202,600 | $0 | $0 |
Source: Public Records
Map
Nearby Homes
- 1605 Mountain Rd
- 147 Winding Way Unit 50
- 159 Winding Way Unit 49
- 10 S 1300 E
- 1374 E 260 N
- 240 N 1480 E
- 1279 Eastridge Dr
- 1387 E 260 N
- 128 S 1170 E
- 1383 Mount Logan Loop
- 357 Paintbrush Ln
- 1034 Thrushwood Dr
- 1045 Fox Farm Rd
- 28 River Pointe Dr
- 1425 E 700 N
- 556 N 520 E
- 820 Hillcrest Ave
- Cedar Ridge Plan at Shoreline Estates
- Strata Plan at Shoreline Estates
- Hamilton Plan at Shoreline Estates
- 89 Winding Way
- 57 Winding Way
- 74 Quail Hollow Rd
- 74 N Quail Hollow Rd Unit 106
- 62 N Quail Hollow Rd
- 62 N Quail Hollow Rd Unit 105
- 105 Winding Way
- 41 Winding Way
- 52 Winding Way
- 94 Winding Way
- 50 Quail Hollow Rd
- 50 N Quail Hollow Rd Unit 104
- 1526 Braxton Place
- 124 N Quail Hollow Rd Unit 108
- 71 Quail Hollow Rd
- 1523 Braxton Place
- 111 Winding Way
- 1497 Mountain Rd
- 71 N Quail Hollow Rd Unit 118
- 1471 Mountain Rd