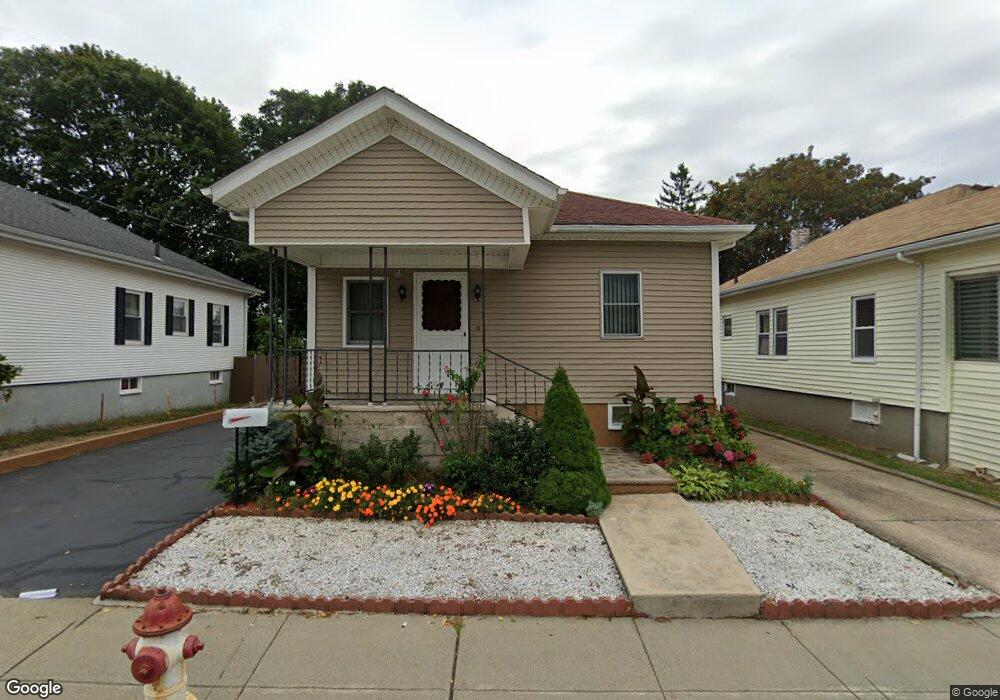
73 Winthrop St Fall River, MA 02721
Maplewood NeighborhoodEstimated Value: $340,000 - $406,000
1
Bed
1
Bath
925
Sq Ft
$391/Sq Ft
Est. Value
About This Home
This home is located at 73 Winthrop St, Fall River, MA 02721 and is currently estimated at $361,283, approximately $390 per square foot. 73 Winthrop St is a home located in Bristol County with nearby schools including Letourneau Elementary School, Matthew J. Kuss Middle School, and B M C Durfee High School.
Ownership History
Date
Name
Owned For
Owner Type
Purchase Details
Closed on
Feb 26, 1996
Sold by
Moniz Joseph S and Moniz Theresa J
Bought by
Bothelho Joseph N and Bothelho Filomena D
Current Estimated Value
Home Financials for this Owner
Home Financials are based on the most recent Mortgage that was taken out on this home.
Original Mortgage
$80,000
Outstanding Balance
$3,142
Interest Rate
7.04%
Mortgage Type
Purchase Money Mortgage
Estimated Equity
$358,141
Purchase Details
Closed on
Oct 19, 1990
Sold by
Hutchins Eric
Bought by
Moniz Jose S
Home Financials for this Owner
Home Financials are based on the most recent Mortgage that was taken out on this home.
Original Mortgage
$79,800
Interest Rate
10.14%
Mortgage Type
Purchase Money Mortgage
Create a Home Valuation Report for This Property
The Home Valuation Report is an in-depth analysis detailing your home's value as well as a comparison with similar homes in the area
Home Values in the Area
Average Home Value in this Area
Purchase History
| Date | Buyer | Sale Price | Title Company |
|---|---|---|---|
| Bothelho Joseph N | $100,000 | -- | |
| Moniz Jose S | $8,400 | -- |
Source: Public Records
Mortgage History
| Date | Status | Borrower | Loan Amount |
|---|---|---|---|
| Open | Moniz Jose S | $80,000 | |
| Previous Owner | Moniz Jose S | $80,000 | |
| Previous Owner | Moniz Jose S | $79,800 |
Source: Public Records
Tax History Compared to Growth
Tax History
| Year | Tax Paid | Tax Assessment Tax Assessment Total Assessment is a certain percentage of the fair market value that is determined by local assessors to be the total taxable value of land and additions on the property. | Land | Improvement |
|---|---|---|---|---|
| 2025 | $3,535 | $308,700 | $125,800 | $182,900 |
| 2024 | $3,314 | $288,400 | $121,000 | $167,400 |
| 2023 | $3,015 | $245,700 | $103,700 | $142,000 |
| 2022 | $2,788 | $220,900 | $94,300 | $126,600 |
| 2021 | $2,607 | $188,500 | $87,300 | $101,200 |
| 2020 | $2,607 | $180,400 | $83,500 | $96,900 |
| 2019 | $2,496 | $171,200 | $79,500 | $91,700 |
| 2018 | $2,308 | $157,900 | $78,100 | $79,800 |
| 2017 | $2,225 | $158,900 | $79,700 | $79,200 |
| 2016 | $2,156 | $158,200 | $82,900 | $75,300 |
| 2015 | $2,030 | $155,200 | $79,900 | $75,300 |
| 2014 | $2,005 | $159,400 | $84,100 | $75,300 |
Source: Public Records
Map
Nearby Homes