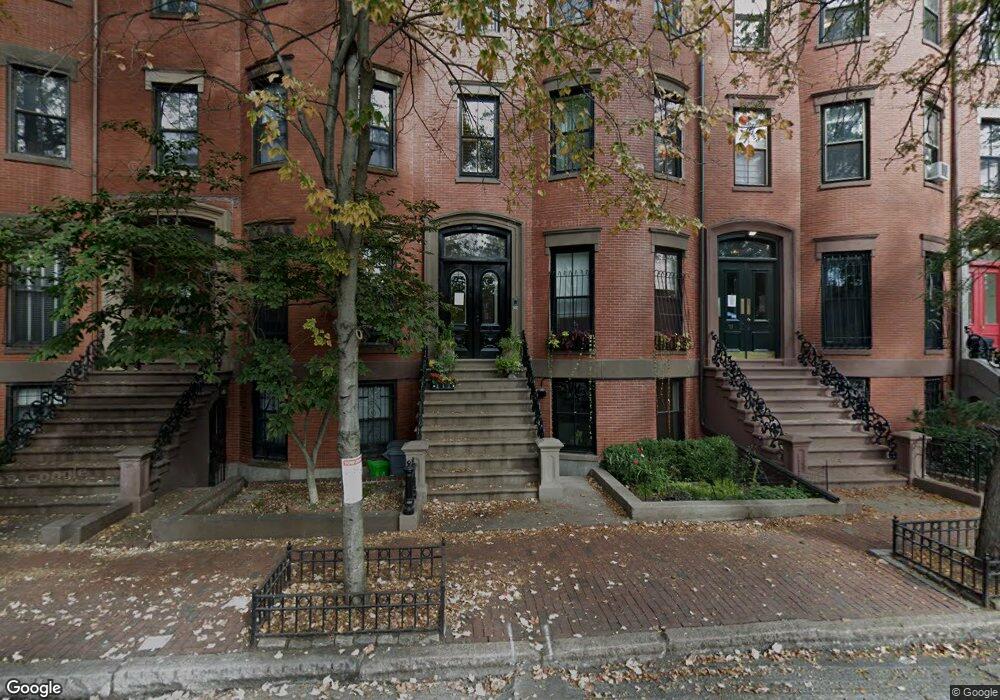
73 Worcester St Unit 3 Boston, MA 02118
South End NeighborhoodEstimated Value: $789,541 - $884,000
2
Beds
1
Bath
730
Sq Ft
$1,159/Sq Ft
Est. Value
About This Home
This home is located at 73 Worcester St Unit 3, Boston, MA 02118 and is currently estimated at $845,885, approximately $1,158 per square foot. 73 Worcester St Unit 3 is a home located in Suffolk County with nearby schools including Edward M. Kennedy Academy for Health Careers and Cathedral High School.
Ownership History
Date
Name
Owned For
Owner Type
Purchase Details
Closed on
May 2, 2025
Sold by
Petti Lois A
Bought by
Lois A Petti T A and Lois Petti
Current Estimated Value
Purchase Details
Closed on
Aug 29, 1995
Sold by
Epstein Bennet S and Dolan Barbara
Bought by
Petti Lois A
Home Financials for this Owner
Home Financials are based on the most recent Mortgage that was taken out on this home.
Original Mortgage
$146,750
Interest Rate
7.32%
Mortgage Type
Purchase Money Mortgage
Purchase Details
Closed on
Feb 13, 1987
Sold by
Worcester St Tr 73
Bought by
Epstein Bennet S
Home Financials for this Owner
Home Financials are based on the most recent Mortgage that was taken out on this home.
Original Mortgage
$143,100
Interest Rate
9.34%
Mortgage Type
Purchase Money Mortgage
Create a Home Valuation Report for This Property
The Home Valuation Report is an in-depth analysis detailing your home's value as well as a comparison with similar homes in the area
Home Values in the Area
Average Home Value in this Area
Purchase History
| Date | Buyer | Sale Price | Title Company |
|---|---|---|---|
| Lois A Petti T A | -- | None Available | |
| Petti Lois A | $154,500 | -- | |
| Petti Lois A | $154,500 | -- | |
| Petti Lois A | $154,500 | -- | |
| Epstein Bennet S | $159,000 | -- |
Source: Public Records
Mortgage History
| Date | Status | Borrower | Loan Amount |
|---|---|---|---|
| Previous Owner | Petti Lois A | $146,750 | |
| Previous Owner | Epstein Bennet S | $143,100 |
Source: Public Records
Tax History Compared to Growth
Tax History
| Year | Tax Paid | Tax Assessment Tax Assessment Total Assessment is a certain percentage of the fair market value that is determined by local assessors to be the total taxable value of land and additions on the property. | Land | Improvement |
|---|---|---|---|---|
| 2025 | $8,340 | $720,200 | $0 | $720,200 |
| 2024 | $7,618 | $698,900 | $0 | $698,900 |
| 2023 | $7,357 | $685,000 | $0 | $685,000 |
| 2022 | $7,380 | $678,300 | $0 | $678,300 |
| 2021 | $7,096 | $665,000 | $0 | $665,000 |
| 2020 | $6,956 | $658,700 | $0 | $658,700 |
| 2019 | $6,739 | $639,400 | $0 | $639,400 |
| 2018 | $6,319 | $603,000 | $0 | $603,000 |
| 2017 | $6,082 | $574,300 | $0 | $574,300 |
| 2016 | $6,074 | $552,200 | $0 | $552,200 |
| 2015 | $6,050 | $499,600 | $0 | $499,600 |
| 2014 | $5,704 | $453,400 | $0 | $453,400 |
Source: Public Records
Map
Nearby Homes
- 67 Worcester St Unit 1
- 116 W Concord St Unit PH
- 125 W Concord St Unit 1
- 43 Worcester St Unit 1
- 548 Massachusetts Ave Unit 3
- 530 Massachusetts Ave Unit 2
- 99 + 101 W Springfield St
- 71 Rutland St Unit 4
- 35-43 Rutland St
- 75 Rutland St Unit 1
- 476 Shawmut Ave Unit 3
- 8 Concord Square Unit 1
- 504 Massachusetts Ave Unit 3
- 12 Concord Square Unit 1
- 193 W Springfield St
- 771 Tremont St Unit 2
- 8 Rutland Square Unit 2
- 15 Concord Square Unit A
- 577 Massachusetts Ave Unit C
- 2 Cumston St
- 73 Worcester St Unit 5
- 73 Worcester St Unit 2
- 73 Worcester St Unit 1
- 75 Worcester St
- 75 Worcester St Unit 3
- 71 Worcester St Unit 5
- 71 Worcester St Unit 4
- 71 Worcester St Unit 2
- 71 Worcester St Unit 1
- 69 Worcester St Unit 4
- 69 Worcester St Unit 3
- 69 Worcester St Unit 2
- 69 Worcester St Unit 1
- 69 Worcester St Unit 1,69
- 77 Worcester St Unit 4
- 77 Worcester St Unit 3
- 77 Worcester St Unit 2
- 77 Worcester St Unit 1
- 67 Worcester St Unit 5
- 67 Worcester St Unit 4