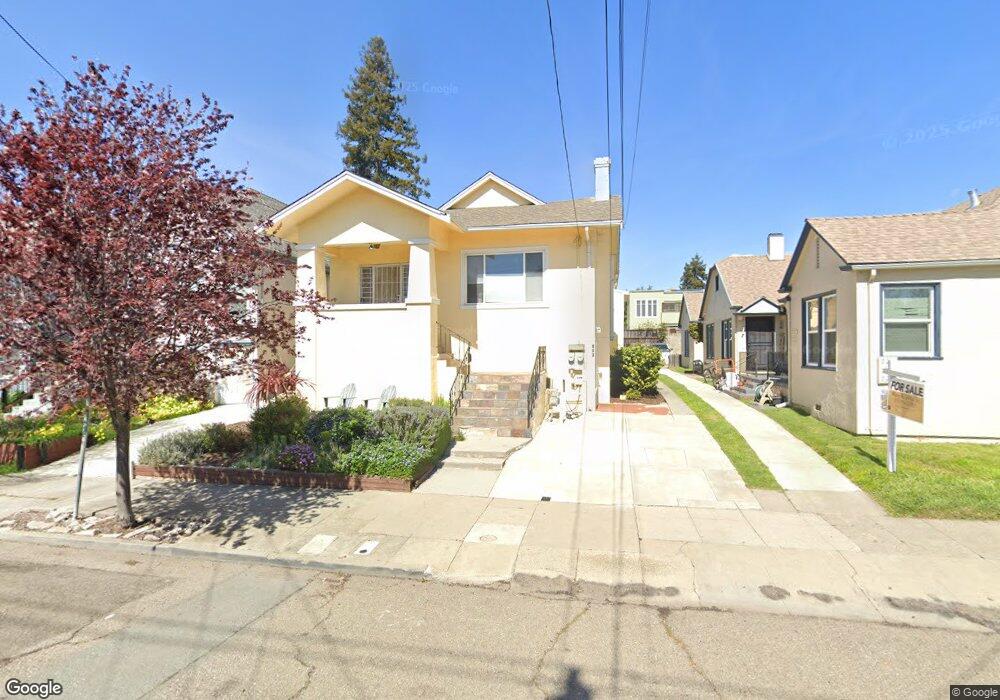
730 59th St Oakland, CA 94609
Santa Fe NeighborhoodEstimated Value: $1,292,484 - $1,509,000
6
Beds
4
Baths
2,656
Sq Ft
$521/Sq Ft
Est. Value
About This Home
This home is located at 730 59th St, Oakland, CA 94609 and is currently estimated at $1,383,621, approximately $520 per square foot. 730 59th St is a home located in Alameda County with nearby schools including Sankofa United Elementary School, Claremont Middle School, and Oakland Technical High School.
Ownership History
Date
Name
Owned For
Owner Type
Purchase Details
Closed on
Jul 23, 2009
Sold by
Doubrava Amanda
Bought by
Doubrava Paul J
Current Estimated Value
Home Financials for this Owner
Home Financials are based on the most recent Mortgage that was taken out on this home.
Original Mortgage
$376,000
Outstanding Balance
$245,402
Interest Rate
5.31%
Mortgage Type
Purchase Money Mortgage
Estimated Equity
$1,138,219
Purchase Details
Closed on
Jul 21, 2009
Sold by
Woon Richard T and Doubrava Paul J
Bought by
Marchman Danielle and Handy Madsen Allegra
Home Financials for this Owner
Home Financials are based on the most recent Mortgage that was taken out on this home.
Original Mortgage
$376,000
Outstanding Balance
$245,402
Interest Rate
5.31%
Mortgage Type
Purchase Money Mortgage
Estimated Equity
$1,138,219
Purchase Details
Closed on
May 20, 2009
Sold by
Scott Jacquelyne E
Bought by
Woon Richard T and Doubrava Paul J
Purchase Details
Closed on
Sep 13, 2005
Sold by
Scott Jacquelyne E
Bought by
Scott Jacquelyne E and Mitchell James
Home Financials for this Owner
Home Financials are based on the most recent Mortgage that was taken out on this home.
Original Mortgage
$532,000
Interest Rate
6.7%
Mortgage Type
Purchase Money Mortgage
Purchase Details
Closed on
Sep 9, 2005
Sold by
Blackwell Charles and Lewis Blackwell Charlene B
Bought by
Scott Jacqueline E
Home Financials for this Owner
Home Financials are based on the most recent Mortgage that was taken out on this home.
Original Mortgage
$532,000
Interest Rate
6.7%
Mortgage Type
Purchase Money Mortgage
Purchase Details
Closed on
May 28, 2003
Sold by
Blackwell Blackwell Charles Edward Charles Edward and Blackwell 2002 Charles Edward
Bought by
Blackwell Charles and Lewis Blackwell Charlene B
Home Financials for this Owner
Home Financials are based on the most recent Mortgage that was taken out on this home.
Original Mortgage
$200,000
Interest Rate
5.61%
Mortgage Type
Purchase Money Mortgage
Purchase Details
Closed on
Sep 26, 2002
Sold by
Blackwell Charles
Bought by
Edward Blackwell Charles Edward and Edward 2002 Charles
Purchase Details
Closed on
Aug 6, 1999
Sold by
Hendon Louise
Bought by
Blackwell Charles
Create a Home Valuation Report for This Property
The Home Valuation Report is an in-depth analysis detailing your home's value as well as a comparison with similar homes in the area
Home Values in the Area
Average Home Value in this Area
Purchase History
| Date | Buyer | Sale Price | Title Company |
|---|---|---|---|
| Doubrava Paul J | -- | Chicago Title Company | |
| Marchman Danielle | $475,000 | Chicago Title Company | |
| Woon Richard T | -- | Chicago Title Company | |
| Woon Richard T | $273,500 | None Available | |
| Scott Jacquelyne E | -- | -- | |
| Scott Jacqueline E | $665,000 | First American Title Co | |
| Blackwell Charles | -- | Orange Coast Title | |
| Edward Blackwell Charles Edward | -- | Orange Coast Title | |
| Edward Blackwell Charles Edward | -- | -- | |
| Blackwell Charles | -- | -- |
Source: Public Records
Mortgage History
| Date | Status | Borrower | Loan Amount |
|---|---|---|---|
| Open | Marchman Danielle | $376,000 | |
| Previous Owner | Scott Jacqueline E | $532,000 | |
| Previous Owner | Blackwell Charles | $200,000 |
Source: Public Records
Tax History
| Year | Tax Paid | Tax Assessment Tax Assessment Total Assessment is a certain percentage of the fair market value that is determined by local assessors to be the total taxable value of land and additions on the property. | Land | Improvement |
|---|---|---|---|---|
| 2025 | $9,928 | $606,096 | $183,929 | $429,167 |
| 2024 | $9,928 | $594,078 | $180,323 | $420,755 |
| 2023 | $10,355 | $589,294 | $176,788 | $412,506 |
| 2022 | $9,999 | $570,741 | $173,322 | $404,419 |
| 2021 | $9,481 | $559,417 | $169,925 | $396,492 |
| 2020 | $9,373 | $560,613 | $168,184 | $392,429 |
| 2019 | $8,968 | $549,621 | $164,886 | $384,735 |
| 2018 | $8,778 | $538,848 | $161,654 | $377,194 |
| 2017 | $8,418 | $528,284 | $158,485 | $369,799 |
| 2016 | $8,139 | $517,930 | $155,379 | $362,551 |
| 2015 | $8,092 | $510,154 | $153,046 | $357,108 |
| 2014 | $8,224 | $500,164 | $150,049 | $350,115 |
Source: Public Records
Map
Nearby Homes
- 5914 Martin Luther King jr Way
- 737 61st St
- 688 57th St
- 852 58th St
- 6015 Adeline St
- 619 62nd St
- 878 57th St
- 882 61st St
- 5718 Adeline St
- 604 56th St
- 558 58th St
- 3233 Ellis St
- 540 57th St
- 6320 Shattuck Ave
- 823 55th St
- 5707 Carberry Ave
- 5659 Telegraph Ave
- 5651 Telegraph Ave
- 6555 Shattuck Ave
- 865 54th St
Your Personal Tour Guide
Ask me questions while you tour the home.