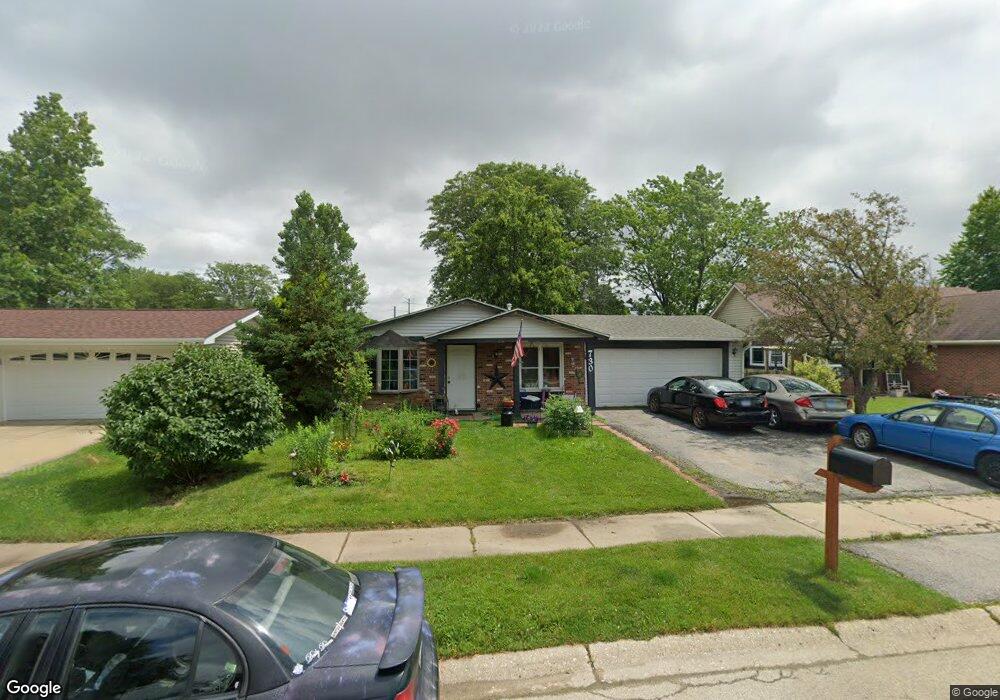
730 Bloomfield Ln Unit 13B Aurora, IL 60504
South East Village NeighborhoodEstimated Value: $279,603 - $322,000
Studio
--
Bath
1,075
Sq Ft
$282/Sq Ft
Est. Value
About This Home
This home is located at 730 Bloomfield Ln Unit 13B, Aurora, IL 60504 and is currently estimated at $303,151, approximately $282 per square foot. 730 Bloomfield Ln Unit 13B is a home located in DuPage County with nearby schools including Georgetown Elementary School, Fischer Middle School, and Waubonsie Valley High School.
Ownership History
Date
Name
Owned For
Owner Type
Purchase Details
Closed on
Nov 27, 2009
Sold by
Morrison Frank P
Bought by
Morrison Rosemary A
Current Estimated Value
Home Financials for this Owner
Home Financials are based on the most recent Mortgage that was taken out on this home.
Original Mortgage
$75,250
Outstanding Balance
$49,384
Interest Rate
5.02%
Mortgage Type
New Conventional
Estimated Equity
$253,767
Purchase Details
Closed on
Apr 29, 1994
Sold by
Prudential Residential Services
Bought by
Morrison Frank P and Morrison Rosemary A
Home Financials for this Owner
Home Financials are based on the most recent Mortgage that was taken out on this home.
Original Mortgage
$85,500
Interest Rate
6.25%
Purchase Details
Closed on
Mar 12, 1994
Sold by
Russell Timothy J and Russell Melanie C
Bought by
Prudential Residential Services
Home Financials for this Owner
Home Financials are based on the most recent Mortgage that was taken out on this home.
Original Mortgage
$85,500
Interest Rate
6.25%
Create a Home Valuation Report for This Property
The Home Valuation Report is an in-depth analysis detailing your home's value as well as a comparison with similar homes in the area
Home Values in the Area
Average Home Value in this Area
Purchase History
| Date | Buyer | Sale Price | Title Company |
|---|---|---|---|
| Morrison Rosemary A | -- | Git | |
| Morrison Frank P | $107,000 | -- | |
| Prudential Residential Services | $107,000 | -- |
Source: Public Records
Mortgage History
| Date | Status | Borrower | Loan Amount |
|---|---|---|---|
| Open | Morrison Rosemary A | $75,250 | |
| Closed | Morrison Frank P | $85,500 |
Source: Public Records
Tax History
| Year | Tax Paid | Tax Assessment Tax Assessment Total Assessment is a certain percentage of the fair market value that is determined by local assessors to be the total taxable value of land and additions on the property. | Land | Improvement |
|---|---|---|---|---|
| 2024 | $5,010 | $81,887 | $26,609 | $55,278 |
| 2023 | $5,330 | $73,580 | $23,910 | $49,670 |
| 2022 | $5,092 | $66,720 | $21,530 | $45,190 |
| 2021 | $4,949 | $64,340 | $20,760 | $43,580 |
| 2020 | $5,010 | $64,340 | $20,760 | $43,580 |
| 2019 | $4,821 | $61,190 | $19,740 | $41,450 |
| 2018 | $4,129 | $52,750 | $16,890 | $35,860 |
| 2017 | $3,771 | $47,850 | $15,320 | $32,530 |
| 2016 | $3,691 | $45,920 | $14,700 | $31,220 |
| 2015 | $3,637 | $43,600 | $13,960 | $29,640 |
| 2014 | $3,826 | $44,400 | $14,110 | $30,290 |
| 2013 | $3,789 | $44,710 | $14,210 | $30,500 |
Source: Public Records
Map
Nearby Homes
- 3115 Village Green Dr
- 2950 Shelly Ln Unit 2950
- 3094 Fairfield Ln
- 3389 Ravinia Cir
- 2797 Shelly Ln
- 2750 Shelly Ln
- 515 Cimarron Dr W Unit 20A
- 465 Echo Ln Unit 2
- 3467 Charlemaine Dr
- 351 Park Ridge Ln Unit D
- 3479 Charlemaine Dr
- 3009 Quincy Ln
- 205 Churchill Ln
- 533 Watercress Dr
- 537 Watercress Dr
- 1335 Lawrence Ct
- 534 Watercress Dr
- 573 Watercress Dr
- 579 Watercress Dr
- 1372 Normantown Rd Unit 341
- 736 Bloomfield Ln
- 726 Bloomfield Ln Unit 13B
- 740 Bloomfield Ln
- 720 Bloomfield Ln
- 735 Bloomfield Ln Unit 13B
- 739 Bloomfield Ln
- 729 Bloomfield Ln Unit 13B
- 746 Bloomfield Ln Unit 13B
- 745 Bloomfield Ln
- 725 Bloomfield Ln
- 3135 Bloomfield Ct Unit 13B
- 3145 Bloomfield Ct Unit 13B
- 749 Bloomfield Ln
- 750 Bloomfield Ln
- 825 Bloomfield Ln
- 815 Bloomfield Ln
- 815 Cloverfield Ln
- 835 Bloomfield Ln Unit 13B
- 805 Bloomfield Ln Unit 13B
- 755 Bloomfield Ln Unit 13B
Your Personal Tour Guide
Ask me questions while you tour the home.