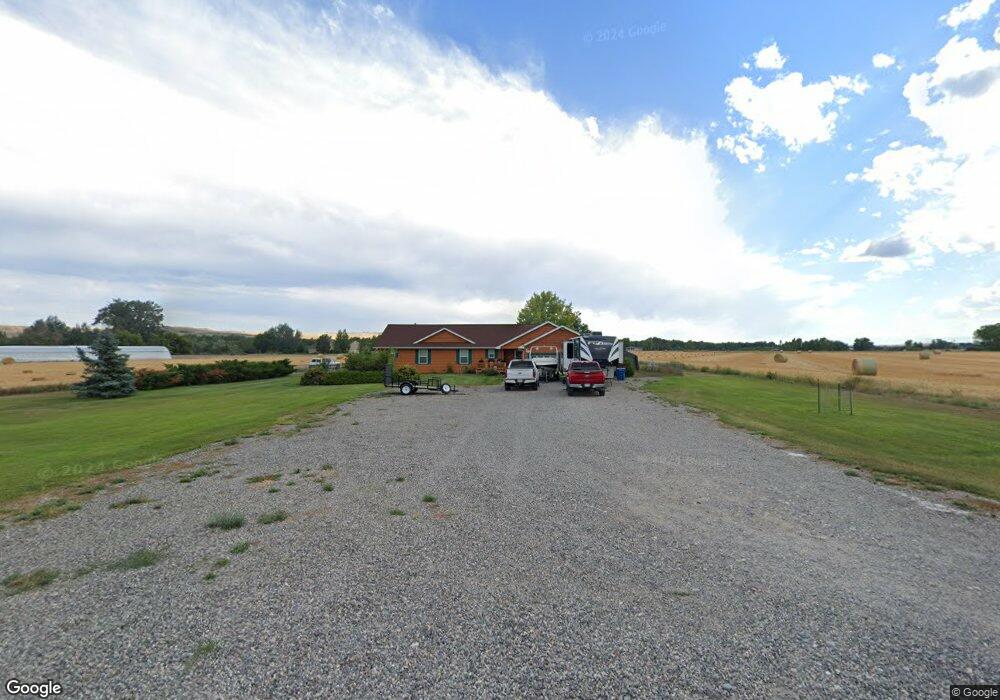
730 Clarks Fork Dr Laurel, MT 59044
Estimated Value: $413,046 - $573,000
2
Beds
2
Baths
1,632
Sq Ft
$293/Sq Ft
Est. Value
About This Home
This home is located at 730 Clarks Fork Dr, Laurel, MT 59044 and is currently estimated at $477,762, approximately $292 per square foot. 730 Clarks Fork Dr is a home located in Yellowstone County with nearby schools including Fred W. Graff School, West School, and Laurel Middle School.
Ownership History
Date
Name
Owned For
Owner Type
Purchase Details
Closed on
Jun 10, 2013
Sold by
Cowan Lillian M
Bought by
Knaub Jared W
Current Estimated Value
Home Financials for this Owner
Home Financials are based on the most recent Mortgage that was taken out on this home.
Original Mortgage
$248,350
Interest Rate
3.37%
Mortgage Type
Future Advance Clause Open End Mortgage
Purchase Details
Closed on
Jul 30, 2012
Sold by
Cowan Lillian M
Bought by
Lillian M Cowan Trust
Purchase Details
Closed on
Jan 30, 2003
Sold by
The Gene D Slater & Corinna M Slater Fam
Bought by
The Leslie Clinton Reynolds Jr Trust
Purchase Details
Closed on
Jan 26, 2000
Sold by
Slater Gene D and Slater Corinna M
Bought by
The Leslie Clinton Reynolds Jr Trust
Create a Home Valuation Report for This Property
The Home Valuation Report is an in-depth analysis detailing your home's value as well as a comparison with similar homes in the area
Purchase History
| Date | Buyer | Sale Price | Title Company |
|---|---|---|---|
| Knaub Jared W | -- | None Available | |
| Lillian M Cowan Trust | -- | None Available | |
| The Leslie Clinton Reynolds Jr Trust | -- | None Available | |
| The Leslie Clinton Reynolds Jr Trust | -- | None Available |
Source: Public Records
Mortgage History
| Date | Status | Borrower | Loan Amount |
|---|---|---|---|
| Closed | Knaub Jared W | $248,350 |
Source: Public Records
Tax History
| Year | Tax Paid | Tax Assessment Tax Assessment Total Assessment is a certain percentage of the fair market value that is determined by local assessors to be the total taxable value of land and additions on the property. | Land | Improvement |
|---|---|---|---|---|
| 2025 | $2,615 | $403,700 | $73,120 | $330,580 |
| 2024 | $2,615 | $376,100 | $57,291 | $318,809 |
| 2023 | $2,614 | $376,100 | $57,291 | $318,809 |
| 2022 | $1,977 | $306,300 | $0 | $0 |
| 2021 | $2,183 | $306,300 | $0 | $0 |
| 2020 | $1,980 | $270,500 | $0 | $0 |
| 2019 | $1,907 | $270,500 | $0 | $0 |
| 2018 | $2,094 | $257,700 | $0 | $0 |
| 2017 | $1,892 | $257,700 | $0 | $0 |
| 2016 | $1,703 | $233,900 | $0 | $0 |
| 2015 | $1,677 | $233,900 | $0 | $0 |
| 2014 | $1,513 | $112,625 | $0 | $0 |
Source: Public Records
Map
Nearby Homes
- 134 Clarks Fork Dr
- 615 Clarks River Rd
- 751 Clarks River Rd
- Lot 16 Clarks Point Dr
- 4320 Moser Dome Rd
- 2275 Shay Rd
- 2460 Clarks Point Dr
- 419 Durland Ave
- 409 Maple Ave
- 208 West Ave
- 211 Woodland Ave
- 120 Forrest Ave
- 2907 Clarks Point Dr
- 102 8th Ave Unit B
- 116 4th Ave
- TBD Wold Rd
- 310 (and 814 w 4) 8th Ave
- 110 E 5th St
- 801 E 4th St
- 516 Pennsylvania Ave
- 3155 Us Highway 212 S
- 5090 Us Hwy 310
- 201 Clarks Fork Dr
- 3165 Us Highway 212 S
- 687 Clarks River Rd
- 3149 Us Highway 212 S
- 685 Clarks River Rd
- 3054 Us Highway 212 S
- 130 Byam Rd
- 17 Vista Ln
- 23 Vista Ln
- 15 Vista Ln
- 13 Vista Ln
- 25 Vista Ln
- 7 Vista Ln
- 3038 Us Highway 212 S
- 27 Vista Ln
- 3 Vista Ln
- 4 Whitehorse Rd N
- 14 Vista Ln
Your Personal Tour Guide
Ask me questions while you tour the home.