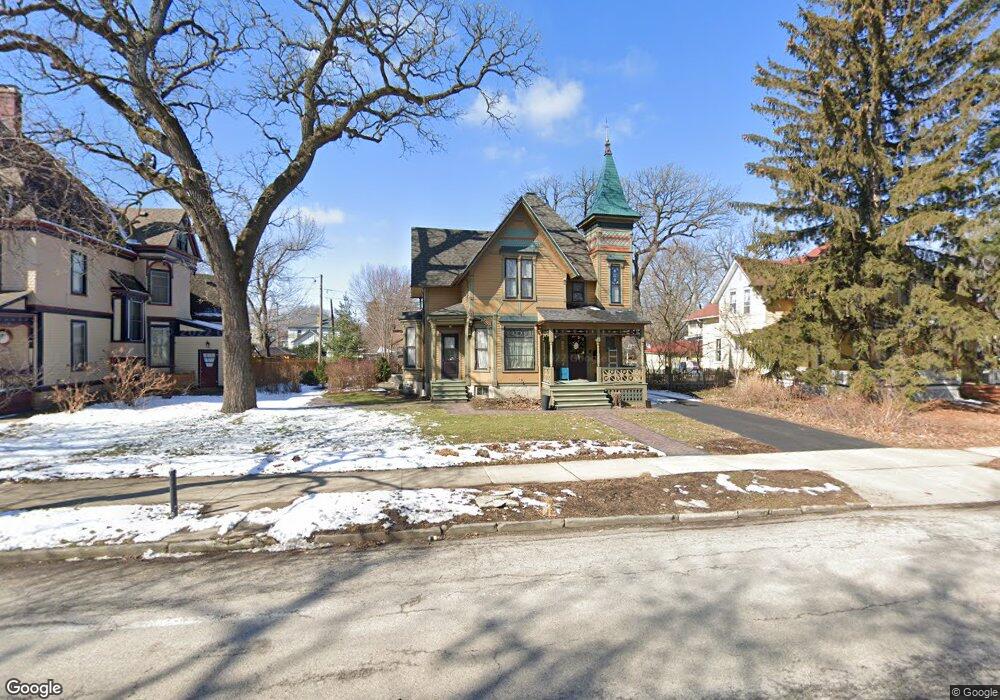
730 Douglas Ave Elgin, IL 60120
Northeast Elgin NeighborhoodEstimated Value: $368,876 - $405,000
5
Beds
2
Baths
2,042
Sq Ft
$188/Sq Ft
Est. Value
About This Home
This home is located at 730 Douglas Ave, Elgin, IL 60120 and is currently estimated at $383,969, approximately $188 per square foot. 730 Douglas Ave is a home located in Kane County with nearby schools including McKinley Elementary School, Larsen Middle School, and Elgin High School.
Ownership History
Date
Name
Owned For
Owner Type
Purchase Details
Closed on
Sep 30, 2004
Sold by
Kain Joseph J and Kain Janice M
Bought by
Brahms Carl and Brahms Nicole
Current Estimated Value
Home Financials for this Owner
Home Financials are based on the most recent Mortgage that was taken out on this home.
Original Mortgage
$206,900
Outstanding Balance
$103,290
Interest Rate
5.89%
Mortgage Type
Purchase Money Mortgage
Estimated Equity
$280,679
Purchase Details
Closed on
Feb 12, 2004
Sold by
Luett David M and Luett Molly
Bought by
Kain Joseph J and Kain Janice M
Home Financials for this Owner
Home Financials are based on the most recent Mortgage that was taken out on this home.
Original Mortgage
$128,000
Interest Rate
5.25%
Mortgage Type
Purchase Money Mortgage
Purchase Details
Closed on
Sep 15, 2000
Sold by
Collingbourne Frank D
Bought by
Luett David M and Friddell Molly
Home Financials for this Owner
Home Financials are based on the most recent Mortgage that was taken out on this home.
Original Mortgage
$137,600
Interest Rate
10.99%
Create a Home Valuation Report for This Property
The Home Valuation Report is an in-depth analysis detailing your home's value as well as a comparison with similar homes in the area
Home Values in the Area
Average Home Value in this Area
Purchase History
| Date | Buyer | Sale Price | Title Company |
|---|---|---|---|
| Brahms Carl | $259,000 | First American Title Ins Co | |
| Kain Joseph J | $160,000 | Multiple | |
| Luett David M | $172,000 | -- |
Source: Public Records
Mortgage History
| Date | Status | Borrower | Loan Amount |
|---|---|---|---|
| Open | Brahms Carl | $206,900 | |
| Previous Owner | Kain Joseph J | $128,000 | |
| Previous Owner | Luett David M | $137,600 | |
| Closed | Brahms Carl | $38,800 |
Source: Public Records
Tax History Compared to Growth
Tax History
| Year | Tax Paid | Tax Assessment Tax Assessment Total Assessment is a certain percentage of the fair market value that is determined by local assessors to be the total taxable value of land and additions on the property. | Land | Improvement |
|---|---|---|---|---|
| 2024 | $7,967 | $107,546 | $20,644 | $86,902 |
| 2023 | $7,600 | $97,159 | $18,650 | $78,509 |
| 2022 | $7,162 | $88,593 | $17,006 | $71,587 |
| 2021 | $6,854 | $82,828 | $15,899 | $66,929 |
| 2020 | $6,664 | $79,072 | $15,178 | $63,894 |
| 2019 | $6,474 | $75,321 | $14,458 | $60,863 |
| 2018 | $6,089 | $67,589 | $13,620 | $53,969 |
| 2017 | $5,955 | $63,896 | $12,876 | $51,020 |
| 2016 | $5,682 | $59,278 | $11,945 | $47,333 |
| 2015 | -- | $54,334 | $10,949 | $43,385 |
| 2014 | -- | $53,663 | $10,814 | $42,849 |
| 2013 | -- | $55,078 | $11,099 | $43,979 |
Source: Public Records
Map
Nearby Homes
- 841 Douglas Ave
- 602 Prospect St
- 939 Prospect St
- 1017 Center St
- 939 Saint John St
- 805 Augusta Ave
- 376 Jefferson Ave
- 315 Congdon Ave
- 1009 Augusta Ave
- 54 Genesee Ave
- LOT 17 Teal Ave
- LOTS 14 & 15 Teal Ave
- 428 Fremont St
- 419 Fremont St
- 643 Wing St
- 1053 Lakeview Rd
- 558 N Crystal St
- 1068 Lake Terrace Rd Unit 235
- 431 N Crystal St
- 241 Little Peninsula Rd