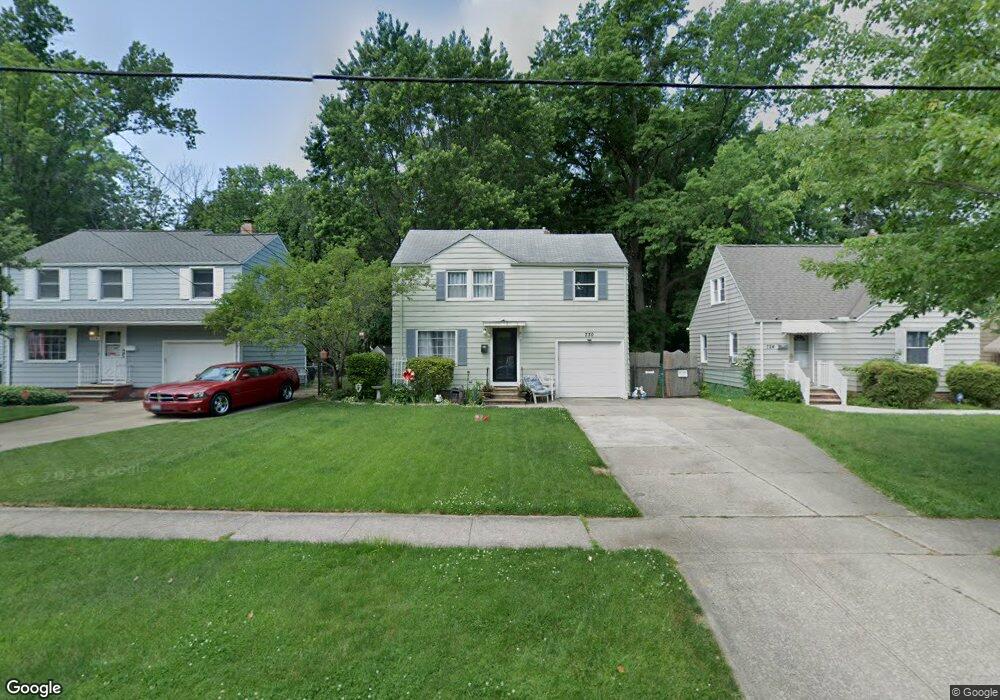
730 E 254th St Euclid, OH 44132
Estimated Value: $123,566 - $148,000
3
Beds
1
Bath
1,160
Sq Ft
$118/Sq Ft
Est. Value
About This Home
This home is located at 730 E 254th St, Euclid, OH 44132 and is currently estimated at $136,392, approximately $117 per square foot. 730 E 254th St is a home located in Cuyahoga County with nearby schools including Shoreview Elementary School, Euclid High School, and Pinnacle Academy.
Ownership History
Date
Name
Owned For
Owner Type
Purchase Details
Closed on
Mar 12, 2010
Sold by
Secretary Of Housing & Urban Development
Bought by
Reynolds Pamela J
Current Estimated Value
Home Financials for this Owner
Home Financials are based on the most recent Mortgage that was taken out on this home.
Original Mortgage
$50,026
Outstanding Balance
$34,006
Interest Rate
5.5%
Mortgage Type
FHA
Estimated Equity
$102,386
Purchase Details
Closed on
May 15, 2008
Sold by
Abilay H John
Bought by
Hud
Purchase Details
Closed on
Nov 15, 1999
Sold by
Mastandrea Nicholas J
Bought by
Abilay H John
Home Financials for this Owner
Home Financials are based on the most recent Mortgage that was taken out on this home.
Original Mortgage
$90,644
Interest Rate
7.88%
Mortgage Type
FHA
Purchase Details
Closed on
Apr 21, 1986
Sold by
Davis Thomas W and Davis Margaret A
Bought by
Davis Thomas W
Purchase Details
Closed on
Jan 1, 1975
Bought by
Davis Thomas W and Davis Margaret A
Create a Home Valuation Report for This Property
The Home Valuation Report is an in-depth analysis detailing your home's value as well as a comparison with similar homes in the area
Home Values in the Area
Average Home Value in this Area
Purchase History
| Date | Buyer | Sale Price | Title Company |
|---|---|---|---|
| Reynolds Pamela J | $28,502 | Attorney | |
| Hud | $60,000 | Attorney | |
| Abilay H John | $91,200 | Real Estate Title | |
| Davis Thomas W | -- | -- | |
| Davis Thomas W | -- | -- |
Source: Public Records
Mortgage History
| Date | Status | Borrower | Loan Amount |
|---|---|---|---|
| Open | Reynolds Pamela J | $50,026 | |
| Previous Owner | Abilay H John | $90,644 |
Source: Public Records
Tax History
| Year | Tax Paid | Tax Assessment Tax Assessment Total Assessment is a certain percentage of the fair market value that is determined by local assessors to be the total taxable value of land and additions on the property. | Land | Improvement |
|---|---|---|---|---|
| 2024 | $2,778 | $40,075 | $8,680 | $31,395 |
| 2023 | $2,561 | $28,490 | $6,580 | $21,910 |
| 2022 | $2,428 | $28,490 | $6,580 | $21,910 |
| 2021 | $2,703 | $28,490 | $6,580 | $21,910 |
| 2020 | $2,565 | $24,570 | $5,670 | $18,900 |
| 2019 | $2,305 | $70,200 | $16,200 | $54,000 |
| 2018 | $2,299 | $24,570 | $5,670 | $18,900 |
| 2017 | $2,462 | $21,740 | $4,690 | $17,050 |
| 2016 | $2,468 | $21,740 | $4,690 | $17,050 |
| 2015 | $2,247 | $21,740 | $4,690 | $17,050 |
| 2014 | $2,247 | $21,740 | $4,690 | $17,050 |
Source: Public Records
Map
Nearby Homes
- 825 E 256th St
- 25650 Richards Ave
- 25700 Briardale Ave
- 25751 Briardale Ave
- 515 E 250th St
- 24181 Devoe Ave
- 24571 Alberton Rd
- 25401 Farringdon Ave
- 464 E 250th St
- 25671 Farringdon Ave
- 643 E 261st St
- 890 E 250th St
- 579 E 260th St
- 26430 Drakefield Ave
- 25151 Zeman Ave
- 571 E 260th St
- 25731 Zeman Ave
- 24891 Zeman Ave
- 26351 Farringdon Ave
- 368 E 248th St
- 724 E 254th St
- 734 E 254th St
- 740 E 254th St
- 744 E 254th St
- 714 E 254th St
- 25300 Rena Ct
- 731 E 254th St
- 735 E 254th St
- 25290 Rena Ct
- 725 E 254th St
- 750 E 254th St
- 750 E 254th St Unit E
- 741 E 254th St
- 710 E 254th St
- 721 E 254th St
- 745 E 254th St
- 754 E 254th St
- 751 E 254 St
- 715 E 254th St
- 751 E 254th St
Your Personal Tour Guide
Ask me questions while you tour the home.