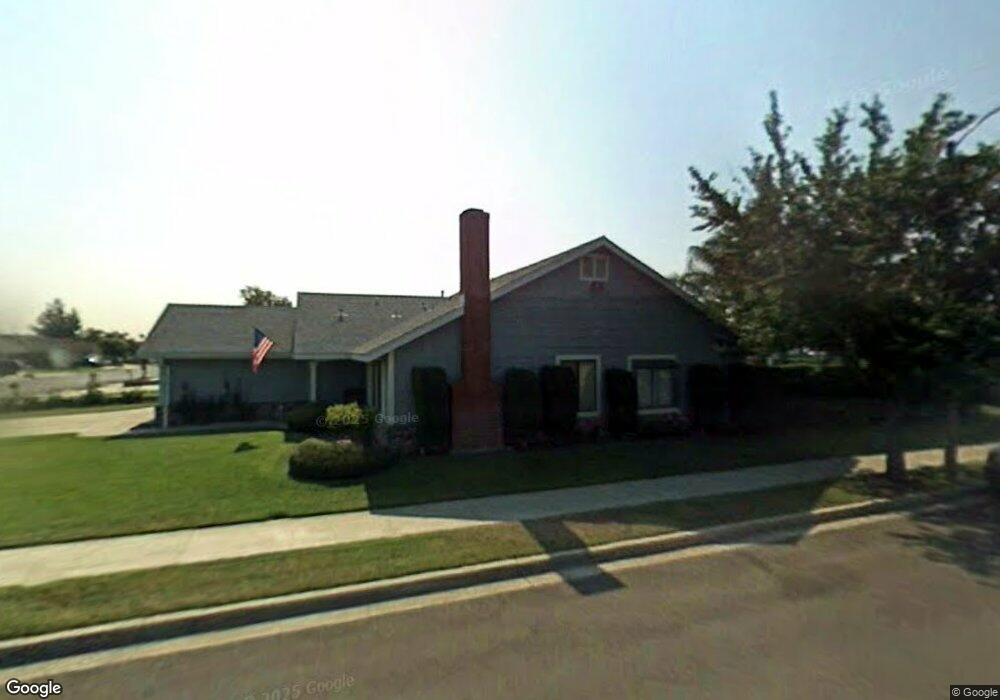
730 E Deerfield St Ontario, CA 91761
Ontario Ranch NeighborhoodEstimated Value: $724,000 - $752,000
3
Beds
2
Baths
1,562
Sq Ft
$472/Sq Ft
Est. Value
About This Home
This home is located at 730 E Deerfield St, Ontario, CA 91761 and is currently estimated at $737,907, approximately $472 per square foot. 730 E Deerfield St is a home located in San Bernardino County with nearby schools including Liberty Elementary School, Woodcrest Junior High, and Chino High School.
Ownership History
Date
Name
Owned For
Owner Type
Purchase Details
Closed on
Apr 6, 2006
Sold by
Juarez Carlos and Juarez Esther
Bought by
Juarez Carlos A and Drew Devi G
Current Estimated Value
Home Financials for this Owner
Home Financials are based on the most recent Mortgage that was taken out on this home.
Original Mortgage
$392,000
Outstanding Balance
$319,525
Interest Rate
7.1%
Mortgage Type
Purchase Money Mortgage
Estimated Equity
$418,382
Purchase Details
Closed on
Mar 9, 2005
Sold by
Juarez Carlos and Juarez Esther
Bought by
Juarez Carlos and Juarez Esther
Home Financials for this Owner
Home Financials are based on the most recent Mortgage that was taken out on this home.
Original Mortgage
$100,000
Interest Rate
5.12%
Mortgage Type
New Conventional
Purchase Details
Closed on
Oct 7, 2002
Sold by
Argueta Juarez Carlos Canales and Argueta Juarez Esther
Bought by
Carlos Canales and Carlos Esther Argueta
Purchase Details
Closed on
Dec 13, 1994
Sold by
Morgan Billy R and Morgan Linda J
Bought by
Juarez Carlos and Juarez Esther
Home Financials for this Owner
Home Financials are based on the most recent Mortgage that was taken out on this home.
Original Mortgage
$95,000
Interest Rate
3.95%
Create a Home Valuation Report for This Property
The Home Valuation Report is an in-depth analysis detailing your home's value as well as a comparison with similar homes in the area
Home Values in the Area
Average Home Value in this Area
Purchase History
| Date | Buyer | Sale Price | Title Company |
|---|---|---|---|
| Juarez Carlos A | $490,000 | Financial Title Company | |
| Juarez Carlos | -- | Financial Title | |
| Carlos Canales | -- | -- | |
| Juarez Carlos | $165,000 | Orange Coast Title Co |
Source: Public Records
Mortgage History
| Date | Status | Borrower | Loan Amount |
|---|---|---|---|
| Open | Juarez Carlos A | $392,000 | |
| Previous Owner | Juarez Carlos | $100,000 | |
| Previous Owner | Juarez Carlos | $95,000 |
Source: Public Records
Tax History
| Year | Tax Paid | Tax Assessment Tax Assessment Total Assessment is a certain percentage of the fair market value that is determined by local assessors to be the total taxable value of land and additions on the property. | Land | Improvement |
|---|---|---|---|---|
| 2025 | $2,975 | $268,751 | $94,062 | $174,689 |
| 2024 | $2,895 | $263,482 | $92,218 | $171,264 |
| 2023 | $2,815 | $258,316 | $90,410 | $167,906 |
| 2022 | $2,798 | $253,251 | $88,637 | $164,614 |
| 2021 | $2,742 | $248,285 | $86,899 | $161,386 |
| 2020 | $2,707 | $245,739 | $86,008 | $159,731 |
| 2019 | $2,659 | $240,921 | $84,322 | $156,599 |
| 2018 | $2,600 | $236,197 | $82,669 | $153,528 |
| 2017 | $2,553 | $231,566 | $81,048 | $150,518 |
| 2016 | $2,388 | $227,026 | $79,459 | $147,567 |
| 2015 | $2,340 | $223,615 | $78,265 | $145,350 |
| 2014 | $2,293 | $219,235 | $76,732 | $142,503 |
Source: Public Records
Map
Nearby Homes
- 683 E Joseph Privado
- 619 E Joseph Privado
- 665 E Riverside Dr Unit 3
- 2644 S Cucamonga Ave
- 2408 S Taylor Place
- 513 E Fairfield Ct
- 2819 S Euclid Ave
- 125 E Saint Andrews St
- 4315 S Grasly Paseo
- 0 Vineyard Unit CV25067044
- 1528 1538 W Holt
- 1305 W North Pinecrest
- 2431 S Marigold Place
- 2300 S Sultana Ave Unit 298
- 2300 S Sultana Ave Unit 286
- 2300 S Sultana Ave Unit 256
- 2300 S Sultana Ave Unit 206
- 310 E Philadelphia St Unit 147
- 310 E Philadelphia St
- 310 E Philadelphia St Unit SPC 102
- 740 E Deerfield St
- 2847 S Caldwell Ave
- 746 E Deerfield St
- 726 E Deerfield St
- 2850 S Taylor Ave
- 2848 S Caldwell Ave
- 2863 S Caldwell Ave
- 735 E Deerfield St
- 731 E Deerfield St
- 720 E Deerfield St
- 741 E Deerfield St
- 2862 S Taylor Ave
- 725 E Deerfield St
- 2854 S Caldwell Ave
- 745 E Deerfield St
- 2871 S Caldwell Ave
- 721 E Deerfield St
- 2870 S Taylor Ave
- 2866 S Caldwell Ave
- 2837 S Taylor Ave
Your Personal Tour Guide
Ask me questions while you tour the home.