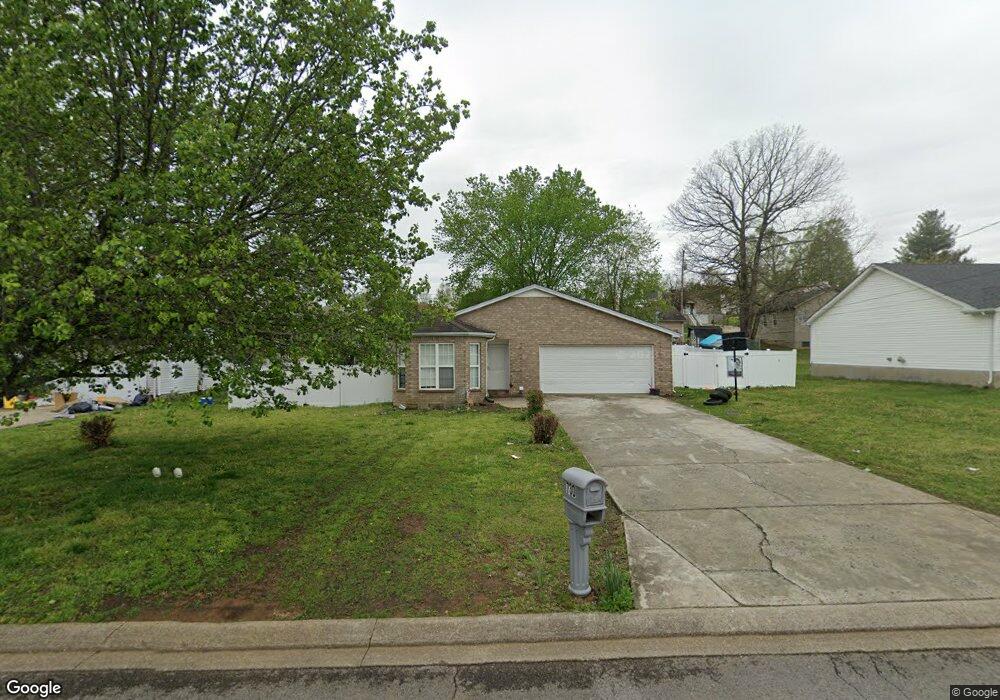
730 Judge Mason Way La Vergne, TN 37086
Estimated Value: $291,000 - $360,000
--
Bed
2
Baths
1,420
Sq Ft
$227/Sq Ft
Est. Value
About This Home
This home is located at 730 Judge Mason Way, La Vergne, TN 37086 and is currently estimated at $322,029, approximately $226 per square foot. 730 Judge Mason Way is a home located in Rutherford County with nearby schools including LaVergne Lake Elementary School, La Vergne Middle School, and Lavergne High School.
Ownership History
Date
Name
Owned For
Owner Type
Purchase Details
Closed on
Jan 29, 2010
Sold by
Tadros Adel R
Bought by
Otoo Stephen K
Current Estimated Value
Home Financials for this Owner
Home Financials are based on the most recent Mortgage that was taken out on this home.
Original Mortgage
$117,826
Outstanding Balance
$79,489
Interest Rate
5.5%
Mortgage Type
FHA
Estimated Equity
$242,540
Purchase Details
Closed on
Feb 27, 2002
Sold by
Hud
Bought by
Tadros Adel R
Home Financials for this Owner
Home Financials are based on the most recent Mortgage that was taken out on this home.
Original Mortgage
$76,080
Interest Rate
6.95%
Purchase Details
Closed on
Oct 22, 2001
Sold by
Marino Dean A
Bought by
Hud
Purchase Details
Closed on
Oct 15, 1996
Sold by
Nevils Enterprises Inc
Bought by
Samantha Schoen
Home Financials for this Owner
Home Financials are based on the most recent Mortgage that was taken out on this home.
Original Mortgage
$101,400
Interest Rate
8.28%
Create a Home Valuation Report for This Property
The Home Valuation Report is an in-depth analysis detailing your home's value as well as a comparison with similar homes in the area
Home Values in the Area
Average Home Value in this Area
Purchase History
| Date | Buyer | Sale Price | Title Company |
|---|---|---|---|
| Otoo Stephen K | $120,000 | -- | |
| Tadros Adel R | $95,100 | -- | |
| Hud | $107,000 | -- | |
| Samantha Schoen | $101,500 | -- |
Source: Public Records
Mortgage History
| Date | Status | Borrower | Loan Amount |
|---|---|---|---|
| Open | Samantha Schoen | $117,826 | |
| Previous Owner | Samantha Schoen | $76,080 | |
| Previous Owner | Samantha Schoen | $101,400 |
Source: Public Records
Tax History Compared to Growth
Tax History
| Year | Tax Paid | Tax Assessment Tax Assessment Total Assessment is a certain percentage of the fair market value that is determined by local assessors to be the total taxable value of land and additions on the property. | Land | Improvement |
|---|---|---|---|---|
| 2025 | $1,609 | $66,675 | $13,750 | $52,925 |
| 2024 | $1,609 | $66,675 | $13,750 | $52,925 |
| 2023 | $1,251 | $66,675 | $13,750 | $52,925 |
| 2022 | $1,078 | $66,675 | $13,750 | $52,925 |
| 2021 | $1,036 | $46,700 | $10,000 | $36,700 |
| 2020 | $1,036 | $46,700 | $10,000 | $36,700 |
| 2019 | $1,036 | $46,700 | $10,000 | $36,700 |
| 2018 | $1,312 | $46,700 | $0 | $0 |
| 2017 | $1,044 | $28,750 | $0 | $0 |
| 2016 | $1,044 | $28,750 | $0 | $0 |
| 2015 | $1,051 | $28,750 | $0 | $0 |
| 2014 | $715 | $28,750 | $0 | $0 |
| 2013 | -- | $29,875 | $0 | $0 |
Source: Public Records
Map
Nearby Homes
- 121 Hidden Forest Ln
- 534 Cedar Park Cir
- 1114 Phelissa Dr
- 120 Bill Stewart Blvd
- 630 Holland Ridge Dr
- 1529 Waxman Dr
- 618 Cedar Bend Ln
- 1626 Jo Ann Dr
- 1321 Tonya Dr
- 603 Hollandale Rd
- 166 Oasis Dr
- 164 Oasis Dr
- 160 Oasis Dr
- 154 Oasis Dr
- 221 Quiet Ln
- 205 Clearlake Dr
- 1710 Chris Dr
- 607 Mable Dr
- 603 E Lake Cove
- 507 Jerald Smith Ln
- 728 Judge Mason Way
- 732 Judge Mason Way
- 829 Carmen Way
- 831 Carmen Way
- 727 Judge Mason Way
- 827 Carmen Way
- 726 Judge Mason Way
- 729 Judge Mason Way
- 734 Judge Mason Way
- 833 Carmen Way
- 725 Judge Mason Way
- 731 Judge Mason Way
- 825 Carmen Way
- 835 Carmen Way
- 724 Judge Mason Way
- 736 Judge Mason Way
- 494 Cedar Park Cir
- 496 Cedar Park Cir
- 733 Judge Mason Way
- 828 Carmen Way