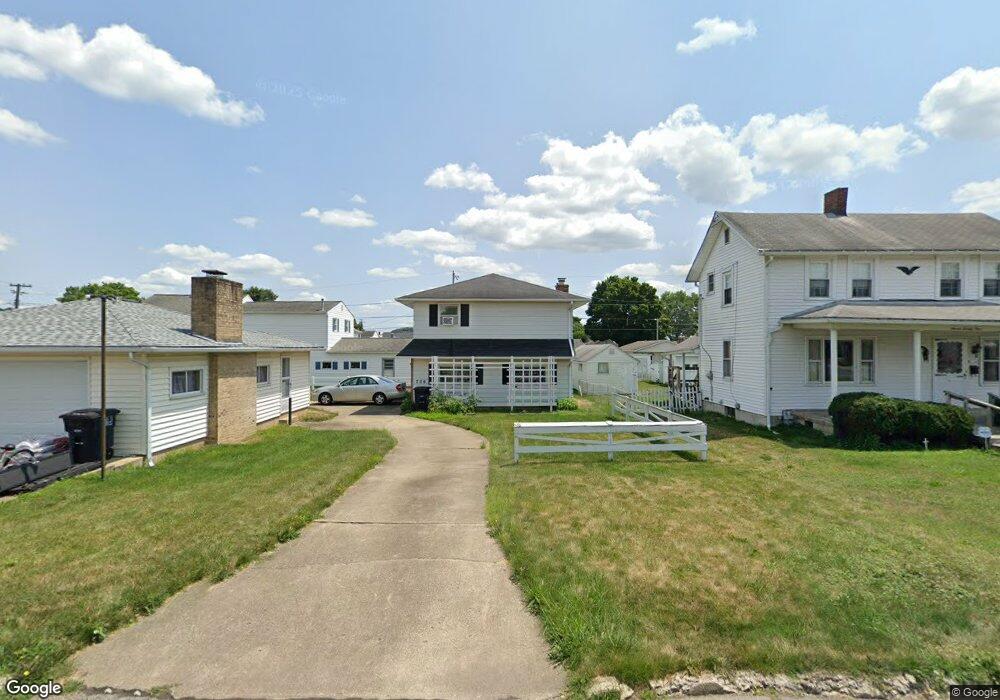
730 N Roosevelt Ave Lancaster, OH 43130
Estimated Value: $146,000 - $192,000
2
Beds
2
Baths
720
Sq Ft
$230/Sq Ft
Est. Value
About This Home
This home is located at 730 N Roosevelt Ave, Lancaster, OH 43130 and is currently estimated at $165,745, approximately $230 per square foot. 730 N Roosevelt Ave is a home located in Fairfield County with nearby schools including General Sherman Junior High School, Lancaster High School, and St Mary Elementary School.
Ownership History
Date
Name
Owned For
Owner Type
Purchase Details
Closed on
Feb 13, 2015
Sold by
Stein Nicholas A and Us Bank Na
Bought by
Green Robert L
Current Estimated Value
Purchase Details
Closed on
Feb 25, 2011
Sold by
Thomas Carl D and Thomas Edith M
Bought by
Stein Nicholas A and Stein Katie A
Home Financials for this Owner
Home Financials are based on the most recent Mortgage that was taken out on this home.
Original Mortgage
$72,319
Interest Rate
4.75%
Mortgage Type
FHA
Purchase Details
Closed on
Feb 21, 2011
Sold by
Miller Joyce A and Miller Roger
Bought by
Stein Nicholas A and Stein Katie A
Home Financials for this Owner
Home Financials are based on the most recent Mortgage that was taken out on this home.
Original Mortgage
$72,319
Interest Rate
4.75%
Mortgage Type
FHA
Purchase Details
Closed on
Aug 11, 2010
Sold by
Thomas Alice
Bought by
Miller Joyce A and Thomas Carl D
Create a Home Valuation Report for This Property
The Home Valuation Report is an in-depth analysis detailing your home's value as well as a comparison with similar homes in the area
Home Values in the Area
Average Home Value in this Area
Purchase History
| Date | Buyer | Sale Price | Title Company |
|---|---|---|---|
| Green Robert L | $46,500 | Attorney | |
| Stein Nicholas A | $37,100 | Real Living Title | |
| Stein Nicholas A | $37,100 | Real Living Title | |
| Miller Joyce A | -- | Attorney |
Source: Public Records
Mortgage History
| Date | Status | Borrower | Loan Amount |
|---|---|---|---|
| Previous Owner | Stein Nicholas A | $72,319 |
Source: Public Records
Tax History Compared to Growth
Tax History
| Year | Tax Paid | Tax Assessment Tax Assessment Total Assessment is a certain percentage of the fair market value that is determined by local assessors to be the total taxable value of land and additions on the property. | Land | Improvement |
|---|---|---|---|---|
| 2024 | $2,880 | $32,040 | $4,810 | $27,230 |
| 2023 | $1,202 | $32,040 | $4,810 | $27,230 |
| 2022 | $1,208 | $32,040 | $4,810 | $27,230 |
| 2021 | $950 | $23,570 | $4,810 | $18,760 |
| 2020 | $912 | $23,570 | $4,810 | $18,760 |
| 2019 | $868 | $23,570 | $4,810 | $18,760 |
| 2018 | $781 | $20,270 | $4,810 | $15,460 |
| 2017 | $781 | $20,270 | $4,810 | $15,460 |
| 2016 | $761 | $20,270 | $4,810 | $15,460 |
| 2015 | $764 | $20,370 | $4,810 | $15,560 |
| 2014 | $728 | $20,370 | $4,810 | $15,560 |
| 2013 | $728 | $20,370 | $4,810 | $15,560 |
Source: Public Records
Map
Nearby Homes
- 1422 Graylock St
- 1628 W Fair Ave
- 943 Garfield Ave
- 844 Washington Ave
- 941 Beacon St
- 628 Harrison Ave
- 401 Busby Ave
- 936 Harrison Ave
- 404 Garfield Ave
- 429 Harrison Ave
- 1000 Goodwin Ave
- 317 Harrison Ave
- 140 Sherman Ave
- 530 W 6th Ave
- 136 Sherman Ave
- 132 N Pierce Ave
- 461 N Shoshone Dr
- 1935 Smith Ave
- 1511 Cedar Hill Rd
- 1318 Cedar Hill Rd
- 724 N Roosevelt Ave
- 1244 8th Ave
- 722 N Roosevelt Ave
- 720 N Roosevelt Ave
- 1232 8th Ave
- 717 N Roosevelt Ave
- 715 N Roosevelt Ave
- 737 N Roosevelt Ave
- 716 N Roosevelt Ave
- 729 Mckinley Ave
- 802 N Roosevelt Ave
- 1228 8th Ave
- 725 N Roosevelt Ave
- 741 N Roosevelt Ave
- 725 Mckinley Ave
- 721 N Roosevelt Ave
- 721 Mckinley Ave
- 712 N Roosevelt Ave
- 804 N Roosevelt Ave
- 1224 8th Ave