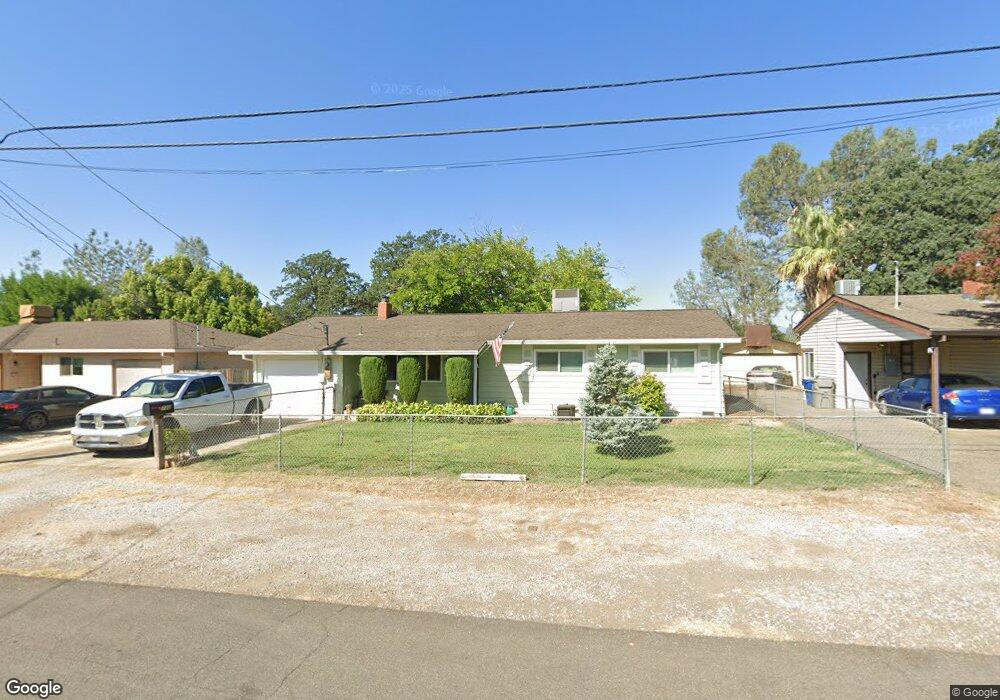
730 Ridge Rd Redding, CA 96003
Twinview NeighborhoodEstimated Value: $193,000 - $301,000
3
Beds
1
Bath
1,100
Sq Ft
$235/Sq Ft
Est. Value
About This Home
This home is located at 730 Ridge Rd, Redding, CA 96003 and is currently estimated at $258,860, approximately $235 per square foot. 730 Ridge Rd is a home located in Shasta County with nearby schools including Rocky Point Charter School.
Ownership History
Date
Name
Owned For
Owner Type
Purchase Details
Closed on
May 11, 2017
Sold by
Larmour James and Warwick Michele
Bought by
Zettler Anthony J
Current Estimated Value
Home Financials for this Owner
Home Financials are based on the most recent Mortgage that was taken out on this home.
Original Mortgage
$110,000
Outstanding Balance
$90,390
Interest Rate
4.02%
Mortgage Type
New Conventional
Estimated Equity
$168,470
Purchase Details
Closed on
Apr 14, 2016
Sold by
Larmour Nesta L
Bought by
Larmour James and Larmour Deborah
Purchase Details
Closed on
Dec 10, 2002
Sold by
Zettler Anthony
Bought by
Larmour Nesta L and Zettler Anthony J
Home Financials for this Owner
Home Financials are based on the most recent Mortgage that was taken out on this home.
Original Mortgage
$35,000
Interest Rate
5.89%
Mortgage Type
Credit Line Revolving
Purchase Details
Closed on
Nov 19, 2002
Sold by
Larmour Nesta L
Bought by
Zettler Anthony J
Home Financials for this Owner
Home Financials are based on the most recent Mortgage that was taken out on this home.
Original Mortgage
$35,000
Interest Rate
5.89%
Mortgage Type
Credit Line Revolving
Create a Home Valuation Report for This Property
The Home Valuation Report is an in-depth analysis detailing your home's value as well as a comparison with similar homes in the area
Home Values in the Area
Average Home Value in this Area
Purchase History
| Date | Buyer | Sale Price | Title Company |
|---|---|---|---|
| Zettler Anthony J | $85,000 | Placer Title Company | |
| Larmour James | -- | None Available | |
| Larmour Nesta L | -- | -- | |
| Zettler Anthony J | -- | Alliance Title Company |
Source: Public Records
Mortgage History
| Date | Status | Borrower | Loan Amount |
|---|---|---|---|
| Open | Zettler Anthony J | $110,000 | |
| Previous Owner | Zettler Anthony J | $35,000 |
Source: Public Records
Tax History
| Year | Tax Paid | Tax Assessment Tax Assessment Total Assessment is a certain percentage of the fair market value that is determined by local assessors to be the total taxable value of land and additions on the property. | Land | Improvement |
|---|---|---|---|---|
| 2025 | $1,418 | $136,650 | $24,201 | $112,449 |
| 2024 | $1,390 | $133,972 | $23,727 | $110,245 |
| 2023 | $1,390 | $131,346 | $23,262 | $108,084 |
| 2022 | $1,351 | $128,771 | $22,806 | $105,965 |
| 2021 | $1,332 | $126,247 | $22,359 | $103,888 |
| 2020 | $1,325 | $124,953 | $22,130 | $102,823 |
| 2019 | $1,283 | $122,504 | $21,697 | $100,807 |
| 2018 | $1,281 | $120,103 | $21,272 | $98,831 |
| 2017 | $976 | $92,158 | $20,771 | $71,387 |
| 2016 | $543 | $54,317 | $6,543 | $47,774 |
| 2015 | $534 | $53,502 | $6,445 | $47,057 |
| 2014 | $536 | $52,455 | $6,319 | $46,136 |
Source: Public Records
Map
Nearby Homes
- 846 Ridge Rd
- 5536 Trish Ct
- 5570 Mountain View Dr
- 581 N Boulder Dr
- 5663 Terra Linda Way
- 1050 Hillsdale Ct
- 633 Marijean Way
- 5976 Sierra Dr
- 5961 Sierra Dr
- 420 Silkwood Dr
- 465 Silkwood Dr
- 5513 Diamond Ridge Dr
- 481 Twin View Blvd
- 362 Lemon Dr
- 459 Red Cedar Dr
- 1131 Redwood Blvd
- 448 Red Cedar Dr
- 466 Balsawood Dr
- 458 Balsawood Dr
- 948 & 950 Hawley
- 742 Ridge Rd
- 706 Ridge Rd
- 754 Ridge Rd
- 733 Ridge Rd
- 766 Ridge Rd
- 692 Ridge Rd
- 721 Ridge Rd
- 745 Ridge Rd
- 653 Valleybrook Lot 27 Dr
- 659 Valleybrook 1weup7muekg4
- 659 Valleybrook Dr Unit lot 26
- 659 Valleybrook Dr
- 665 Valleybrook 1weup7muekg4
- 665 Valleybrook Dr
- 757 Ridge Rd Unit 1
- 757 Ridge Rd
- 703 Ridge Rd
- 780 Ridge Rd
- 682 Ridge Rd
- 769 Ridge Rd
Your Personal Tour Guide
Ask me questions while you tour the home.