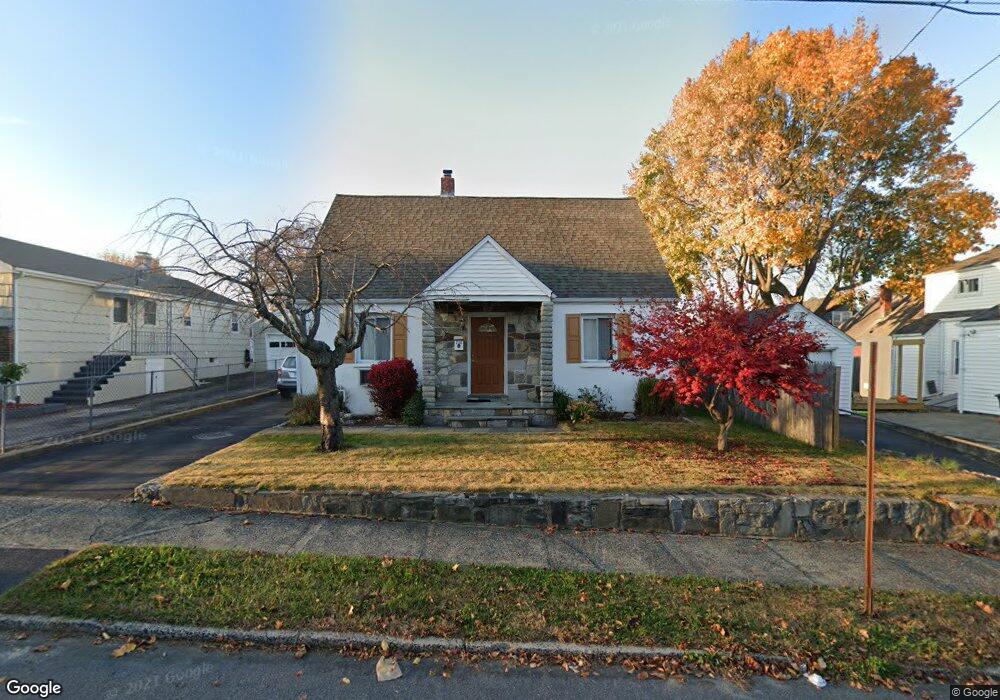
730 Ruth St Bridgeport, CT 06606
North End NeighborhoodEstimated Value: $376,000 - $397,000
3
Beds
1
Bath
1,248
Sq Ft
$310/Sq Ft
Est. Value
About This Home
This home is located at 730 Ruth St, Bridgeport, CT 06606 and is currently estimated at $387,086, approximately $310 per square foot. 730 Ruth St is a home located in Fairfield County with nearby schools including Blackham School, Central High School, and St Andrew School.
Ownership History
Date
Name
Owned For
Owner Type
Purchase Details
Closed on
Jul 29, 2016
Sold by
Queiroga Artur
Bought by
Queiroga Artur
Current Estimated Value
Home Financials for this Owner
Home Financials are based on the most recent Mortgage that was taken out on this home.
Original Mortgage
$60,000
Outstanding Balance
$47,966
Interest Rate
3.54%
Mortgage Type
Unknown
Estimated Equity
$339,120
Purchase Details
Closed on
Jul 12, 1994
Sold by
Carney Willliam F Est
Bought by
Queiroga Arthur
Create a Home Valuation Report for This Property
The Home Valuation Report is an in-depth analysis detailing your home's value as well as a comparison with similar homes in the area
Home Values in the Area
Average Home Value in this Area
Purchase History
| Date | Buyer | Sale Price | Title Company |
|---|---|---|---|
| Queiroga Artur | $105,000 | -- | |
| Queiroga Artur | $105,000 | -- | |
| Queiroga Arthur | $74,900 | -- | |
| Queiroga Arthur V | $74,900 | -- |
Source: Public Records
Mortgage History
| Date | Status | Borrower | Loan Amount |
|---|---|---|---|
| Open | Queiroga Arthur V | $60,000 | |
| Closed | Queiroga Arthur V | $60,000 | |
| Previous Owner | Queiroga Arthur V | $60,000 | |
| Previous Owner | Queiroga Arthur V | $64,000 |
Source: Public Records
Tax History
| Year | Tax Paid | Tax Assessment Tax Assessment Total Assessment is a certain percentage of the fair market value that is determined by local assessors to be the total taxable value of land and additions on the property. | Land | Improvement |
|---|---|---|---|---|
| 2025 | $6,393 | $147,140 | $75,310 | $71,830 |
| 2024 | $6,393 | $147,140 | $75,310 | $71,830 |
| 2023 | $6,393 | $147,140 | $75,310 | $71,830 |
| 2022 | $6,393 | $147,140 | $75,310 | $71,830 |
| 2021 | $6,393 | $147,140 | $75,310 | $71,830 |
| 2020 | $5,414 | $100,280 | $39,340 | $60,940 |
| 2019 | $5,414 | $100,280 | $39,340 | $60,940 |
| 2018 | $5,452 | $100,280 | $39,340 | $60,940 |
| 2017 | $5,452 | $100,280 | $39,340 | $60,940 |
| 2016 | $5,452 | $100,280 | $39,340 | $60,940 |
| 2015 | $5,313 | $125,900 | $47,600 | $78,300 |
| 2014 | $5,313 | $125,900 | $47,600 | $78,300 |
Source: Public Records
Map
Nearby Homes
- 720 Queen St
- 619 Queen St
- 605 Merritt St
- 533 Glendale Ave
- 932 Thorme St
- 575 Burnsford Ave
- 90 Lu Manor Dr
- 260 Toilsome Place
- 3989 Park Ave
- 604 Birmingham St
- 419 Valley Rd
- 574 Thorme St
- 3200 Park Ave Unit 11E2
- 3200 Park Ave Unit 5F1
- 339 Goldenrod Ave
- 316 Goldenrod Ave
- 2800 Madison Ave Unit 1B
- 230 Cherry Hill Dr Unit 2B
- 153 Cherry Hill Dr Unit 2B
- 81 Cherry Hill Dr Unit 1B
Your Personal Tour Guide
Ask me questions while you tour the home.