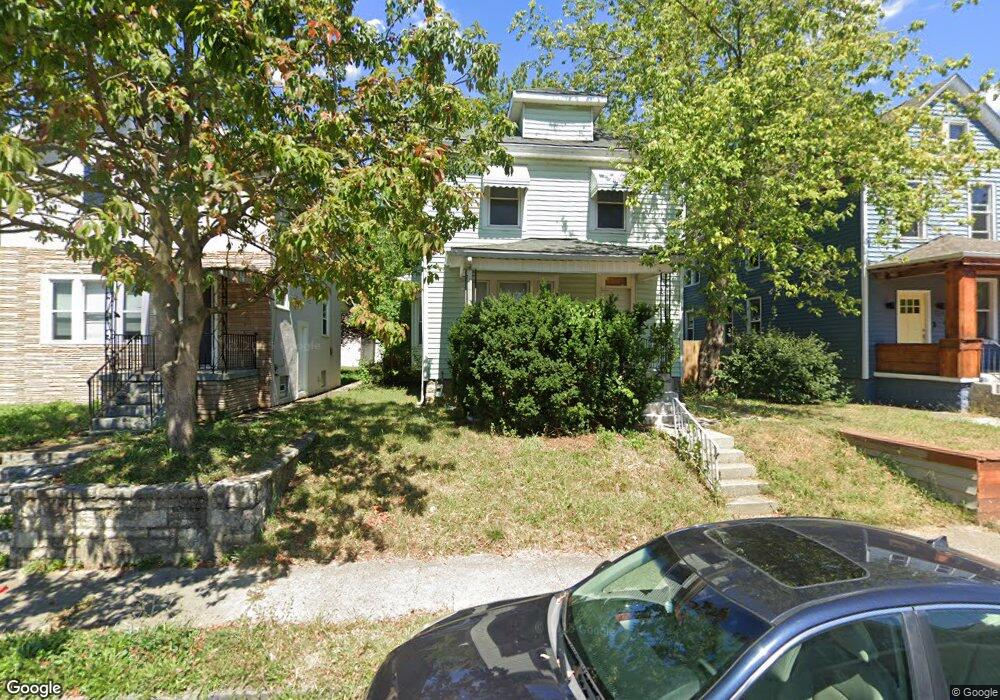
730 Siebert St Columbus, OH 43206
Karns Park NeighborhoodEstimated Value: $154,000 - $202,000
3
Beds
1
Bath
1,082
Sq Ft
$162/Sq Ft
Est. Value
About This Home
This home is located at 730 Siebert St, Columbus, OH 43206 and is currently estimated at $175,669, approximately $162 per square foot. 730 Siebert St is a home located in Franklin County with nearby schools including Lincoln Park Elementary School, South High School, and A+ Arts Academy.
Ownership History
Date
Name
Owned For
Owner Type
Purchase Details
Closed on
Feb 24, 2011
Sold by
The Ohio State Bank
Bought by
F26 Holdings Llc
Current Estimated Value
Purchase Details
Closed on
Feb 3, 2010
Sold by
Slaughter Carl A and Case #08 Cve 05 7320
Bought by
The Ohio State Bank
Purchase Details
Closed on
Jan 26, 2007
Sold by
Kirkham Scott G and Clarke Reid Barbara E
Bought by
Slaughter Carl A
Home Financials for this Owner
Home Financials are based on the most recent Mortgage that was taken out on this home.
Original Mortgage
$69,000
Interest Rate
6.16%
Mortgage Type
Credit Line Revolving
Purchase Details
Closed on
Mar 24, 2005
Sold by
Estate Of Martha A Allen
Bought by
Woodford Carl H
Purchase Details
Closed on
Feb 14, 2005
Sold by
Woodford Carl H and Woodford Diedre
Bought by
Kirkham Scott G
Purchase Details
Closed on
Jun 16, 1993
Bought by
Allen Martha A
Create a Home Valuation Report for This Property
The Home Valuation Report is an in-depth analysis detailing your home's value as well as a comparison with similar homes in the area
Home Values in the Area
Average Home Value in this Area
Purchase History
| Date | Buyer | Sale Price | Title Company |
|---|---|---|---|
| F26 Holdings Llc | $22,000 | Chase Title | |
| The Ohio State Bank | $38,000 | Attorney | |
| Slaughter Carl A | $48,900 | Title Co Lt | |
| Woodford Carl H | $18,100 | -- | |
| Kirkham Scott G | $40,000 | Independent | |
| Allen Martha A | $38,900 | -- |
Source: Public Records
Mortgage History
| Date | Status | Borrower | Loan Amount |
|---|---|---|---|
| Previous Owner | Slaughter Carl A | $69,000 |
Source: Public Records
Tax History
| Year | Tax Paid | Tax Assessment Tax Assessment Total Assessment is a certain percentage of the fair market value that is determined by local assessors to be the total taxable value of land and additions on the property. | Land | Improvement |
|---|---|---|---|---|
| 2025 | $2,713 | $59,190 | $20,970 | $38,220 |
| 2024 | $2,713 | $59,190 | $20,970 | $38,220 |
| 2023 | $2,876 | $59,185 | $20,965 | $38,220 |
| 2022 | $945 | $17,780 | $5,040 | $12,740 |
| 2021 | $947 | $17,780 | $5,040 | $12,740 |
| 2020 | $948 | $17,780 | $5,040 | $12,740 |
| 2019 | $823 | $13,240 | $3,890 | $9,350 |
| 2018 | $411 | $13,240 | $3,890 | $9,350 |
| 2017 | $823 | $13,240 | $3,890 | $9,350 |
| 2016 | $938 | $13,800 | $3,120 | $10,680 |
| 2015 | $427 | $13,800 | $3,120 | $10,680 |
| 2014 | $856 | $13,800 | $3,120 | $10,680 |
| 2013 | $444 | $14,525 | $3,290 | $11,235 |
Source: Public Records
Map
Nearby Homes
- 760 Siebert St
- 726 Reinhard Ave
- 000 Gilbert St
- 00 Gilbert St
- 779-781 Stanley Ave
- 961 Heyl Ave
- 959 Heyl Ave
- 975 Carpenter St
- 640 E Whittier St
- 960 Carpenter St
- 674 Stanley Ave
- 582 Siebert St
- 1226-1228 Gilbert St
- 841 S 22nd St
- 1230 Gilbert St Unit 2
- 999 S 22nd St
- 630 Stanley Ave
- 550 Stewart Ave
- 693 Thurman Ave
- 1065-1067 S Ohio Ave
- 734 Siebert St
- 738 Siebert St
- 720 Siebert St
- 740 Siebert St Unit 742
- 716 Siebert St
- 712 Siebert St
- 708 Siebert St
- 752 Siebert St Unit 754
- 737 Reinhard Ave Unit 739
- 747 Reinhard Ave
- 751 Heyl Ave
- 727 Reinhard Ave
- 751 Reinhard Ave
- 751 Reinhard Ave Unit 751 1/2
- 751 Reinhard Ave Unit 751 & 751 1/2
- 1062 S 18th St
- 756 Siebert St
- 727 Siebert St
- 721 Reinhard Ave
- 723 Siebert St
Your Personal Tour Guide
Ask me questions while you tour the home.