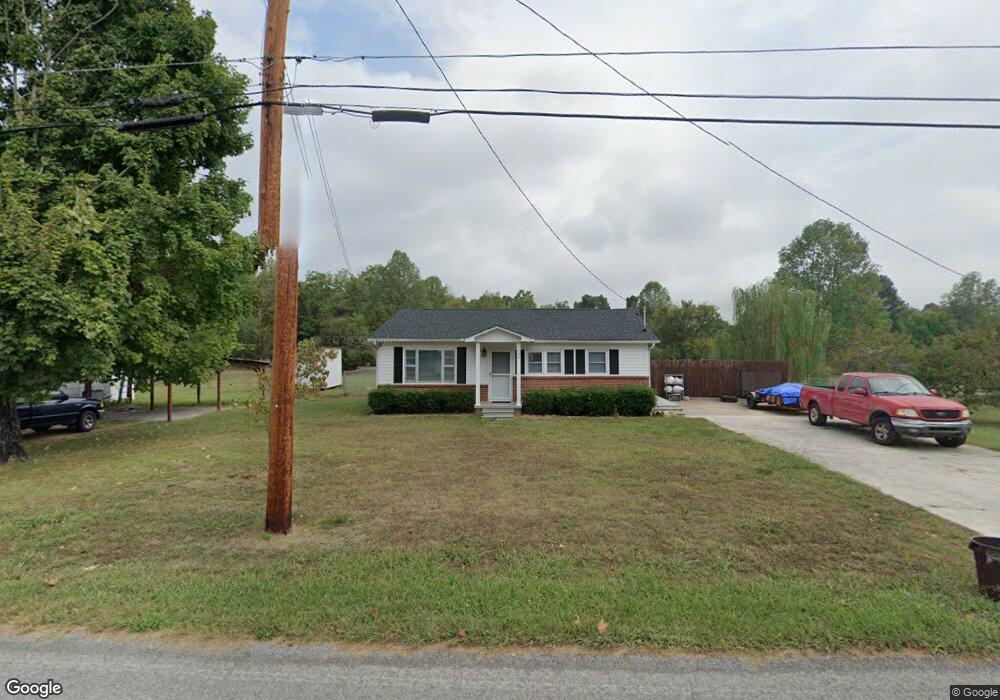
730 W Jackson Ave Spring City, TN 37381
Estimated Value: $161,000 - $183,000
--
Bed
1
Bath
1,008
Sq Ft
$167/Sq Ft
Est. Value
About This Home
This home is located at 730 W Jackson Ave, Spring City, TN 37381 and is currently estimated at $168,506, approximately $167 per square foot. 730 W Jackson Ave is a home located in Rhea County with nearby schools including Rhea County High School, King Memorial Seventh Day Adve, and Spring City Christian Academy.
Ownership History
Date
Name
Owned For
Owner Type
Purchase Details
Closed on
Jun 30, 2016
Sold by
Ervin Patricia L Mathis
Bought by
Morris Luke and Morris Andrea
Current Estimated Value
Home Financials for this Owner
Home Financials are based on the most recent Mortgage that was taken out on this home.
Original Mortgage
$72,659
Outstanding Balance
$32,845
Interest Rate
3.5%
Mortgage Type
FHA
Estimated Equity
$135,661
Purchase Details
Closed on
Jun 15, 2012
Sold by
Ervin Patricia L Mathis
Bought by
Ervin Patricia L Mathis and Ervin Robert Wilson
Purchase Details
Closed on
Sep 27, 1995
Bought by
Mathis Earl Thomas and Mathis Margaret Beatrice
Purchase Details
Closed on
Apr 19, 1990
Bought by
Price Joyce M Etvir Lester V
Purchase Details
Closed on
Jul 15, 1969
Bought by
Mathis Clyde
Create a Home Valuation Report for This Property
The Home Valuation Report is an in-depth analysis detailing your home's value as well as a comparison with similar homes in the area
Home Values in the Area
Average Home Value in this Area
Purchase History
| Date | Buyer | Sale Price | Title Company |
|---|---|---|---|
| Morris Luke | $74,000 | -- | |
| Ervin Patricia L Mathis | -- | -- | |
| Mathis Earl Thomas | $25,000 | -- | |
| Price Joyce M Etvir Lester V | $10,000 | -- | |
| Mathis Clyde | -- | -- |
Source: Public Records
Mortgage History
| Date | Status | Borrower | Loan Amount |
|---|---|---|---|
| Open | Morris Luke | $72,659 | |
| Previous Owner | Mathis Clyde | $50,000 |
Source: Public Records
Tax History Compared to Growth
Tax History
| Year | Tax Paid | Tax Assessment Tax Assessment Total Assessment is a certain percentage of the fair market value that is determined by local assessors to be the total taxable value of land and additions on the property. | Land | Improvement |
|---|---|---|---|---|
| 2024 | -- | $37,850 | $11,750 | $26,100 |
| 2023 | $768 | $20,075 | $5,275 | $14,800 |
| 2022 | $758 | $20,075 | $5,275 | $14,800 |
| 2021 | $744 | $20,075 | $5,275 | $14,800 |
| 2020 | $676 | $20,075 | $5,275 | $14,800 |
| 2019 | $676 | $20,075 | $5,275 | $14,800 |
| 2018 | $591 | $17,875 | $4,650 | $13,225 |
| 2017 | $565 | $17,875 | $4,650 | $13,225 |
| 2016 | $565 | $17,875 | $4,650 | $13,225 |
| 2015 | $547 | $17,875 | $4,650 | $13,225 |
| 2014 | $375 | $17,875 | $4,650 | $13,225 |
| 2013 | -- | $17,875 | $4,650 | $13,225 |
Source: Public Records
Map
Nearby Homes
- 393 Pocahontas Ave
- 676 W Rhea Ave
- 000 Wassom Memorial Hwy
- 498 W Rhea Ave
- 281 Ketchersid Ave
- 229 Pierce St
- 225 Spring St
- 491 Piccadilly Ave
- 229 Pierce Hill Rd
- 229 Pierce Hill St
- 107 &149 E Jackson Ave
- 107 E Jackson Ave
- 0 Bayshore Dr Unit SPRING CITY TN 37381
- 174 E Jackson Ave
- 277 Cemetery Rd
- 220 Hard Rector Ln
- 0 Beach Rd Unit RTC2986615
- 0 Beach Rd Unit 1508308
- Lot 33 Hinch St
- Lot 32 Hinch St
- 778 Jacksonw
- 778 W Jackson Ave
- 005 Shut In Gap Rd
- 798 W Jackson Ave
- 726 W Jackson Ave
- 755 W Jackson Ave
- 747 W Jackson Ave
- 799 W Jackson Ave
- 799 W Jackson Ave Unit West Jackson
- 816 W Jackson Ave
- 725 W Jackson Ave
- 807 W Jackson Ave
- 711 W Jackson Ave
- 698 W Jackson Ave
- 825 W Jackson Ave
- 344 Pocahontas Ave
- 10 Shut In Gap Rd
- 360 Pocahontas Ave
- 322 Pocahontas Ave
- 921 Pocahontas Ave