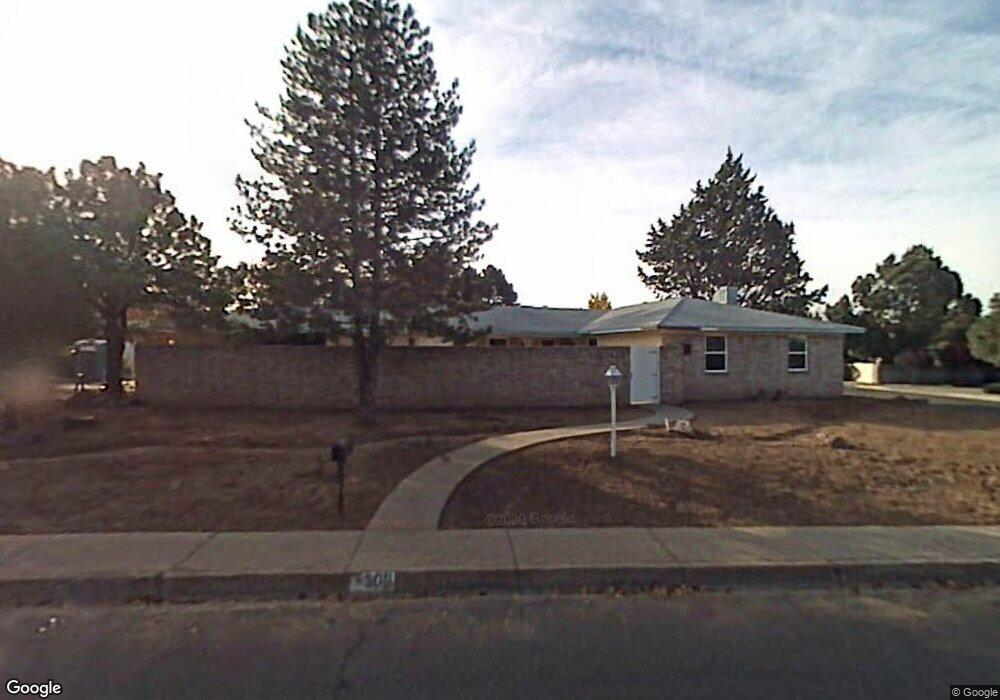
7300 Arroyo Del Oso Ave NE Albuquerque, NM 87109
Highlands North NeighborhoodEstimated Value: $511,000 - $577,000
3
Beds
3
Baths
2,650
Sq Ft
$210/Sq Ft
Est. Value
About This Home
This home is located at 7300 Arroyo Del Oso Ave NE, Albuquerque, NM 87109 and is currently estimated at $556,820, approximately $210 per square foot. 7300 Arroyo Del Oso Ave NE is a home located in Bernalillo County with nearby schools including Comanche Elementary School, Cleveland Middle School, and Sandia High School.
Ownership History
Date
Name
Owned For
Owner Type
Purchase Details
Closed on
Feb 4, 2021
Sold by
Dillard Ryan T and Dillard Gina M
Bought by
Seybert Timothy R and Seybert Margaret
Current Estimated Value
Purchase Details
Closed on
May 3, 2007
Sold by
Black Dorothy Louise Skousen
Bought by
Dillard Ryan T and Dillard Gina M
Home Financials for this Owner
Home Financials are based on the most recent Mortgage that was taken out on this home.
Original Mortgage
$268,800
Interest Rate
6.13%
Mortgage Type
Purchase Money Mortgage
Purchase Details
Closed on
Aug 18, 2003
Sold by
Black Dorothy Louise Skousen and Black Frederick Edward
Bought by
Black Frederick E and Black Dorothy Louise
Home Financials for this Owner
Home Financials are based on the most recent Mortgage that was taken out on this home.
Original Mortgage
$142,200
Interest Rate
5.51%
Mortgage Type
Purchase Money Mortgage
Create a Home Valuation Report for This Property
The Home Valuation Report is an in-depth analysis detailing your home's value as well as a comparison with similar homes in the area
Home Values in the Area
Average Home Value in this Area
Purchase History
| Date | Buyer | Sale Price | Title Company |
|---|---|---|---|
| Seybert Timothy R | -- | None Available | |
| Dillard Ryan T | -- | Landamerica Albuquerque Titl | |
| Black Frederick E | -- | Albuquerque Title |
Source: Public Records
Mortgage History
| Date | Status | Borrower | Loan Amount |
|---|---|---|---|
| Previous Owner | Dillard Ryan T | $268,800 | |
| Previous Owner | Black Frederick E | $142,200 |
Source: Public Records
Tax History Compared to Growth
Tax History
| Year | Tax Paid | Tax Assessment Tax Assessment Total Assessment is a certain percentage of the fair market value that is determined by local assessors to be the total taxable value of land and additions on the property. | Land | Improvement |
|---|---|---|---|---|
| 2025 | $5,297 | $129,310 | $25,317 | $103,993 |
| 2024 | $5,297 | $125,544 | $24,580 | $100,964 |
| 2023 | $5,209 | $121,888 | $23,864 | $98,024 |
| 2022 | $5,184 | $121,888 | $23,864 | $98,024 |
| 2021 | $3,744 | $90,432 | $25,812 | $64,620 |
| 2020 | $3,680 | $87,798 | $25,060 | $62,738 |
| 2019 | $3,570 | $85,242 | $24,331 | $60,911 |
| 2018 | $3,440 | $85,242 | $24,331 | $60,911 |
| 2017 | $3,332 | $82,759 | $23,622 | $59,137 |
| 2016 | $3,234 | $78,008 | $22,266 | $55,742 |
| 2015 | $75,737 | $75,737 | $21,618 | $54,119 |
| 2014 | $3,037 | $73,531 | $20,988 | $52,543 |
| 2013 | -- | $71,390 | $20,377 | $51,013 |
Source: Public Records
Map
Nearby Homes
- 7412 Arroyo Del Oso Ave NE
- 7212 Carriage Rd NE
- 7408 Lantern Rd NE
- 7104 Lantern Rd NE
- 7523 Northridge Ave NE
- 7511 Prairie Rd NE
- 7520 Vista Del Arroyo Ave NE
- 6813 Los Trechos Ct NE
- 4105 Chama St NE
- 7503 Lamplighter Ln NE
- 6009 Brenda St NE
- 4212 Marla Dr NE
- 4612 Sherwood St NE
- 5605 Fair Oak Trail NE
- 8224 Florence Ave NE
- 7212 Carriveau Ave NE
- 6300 Topke Place NE
- 8201 Avenida La Prestina NE
- 4708 Sherwood St NE
- 8209 Avenida La Prestina NE
- 7304 Arroyo Del Oso Ave NE
- 4316 Candlestick Dr NE
- 7305 Arroyo Del Oso Ave NE
- 7212 Arroyo Del Oso Ave NE
- 7301 Arroyo Del Oso Ave NE
- 7308 Arroyo Del Oso Ave NE
- 7213 Lantern Rd NE
- 7312 Arroyo Del Oso Ave NE
- 7209 Arroyo Del Oso Ave NE
- 7309 Arroyo Del Oso Ave NE
- 7208 Arroyo Del Oso Ave NE
- 4313 Heritage Place NE
- 4309 Heritage Place NE
- 7209 Lantern Rd NE
- 7300 Vista Del Arroyo Ave NE
- 4308 Candlestick Dr NE
- 7205 Arroyo Del Oso Ave NE
- 7304 Vista Del Arroyo Ave NE
- 7308 Vista Del Arroyo Ave NE
- 7212 Lantern Rd NE