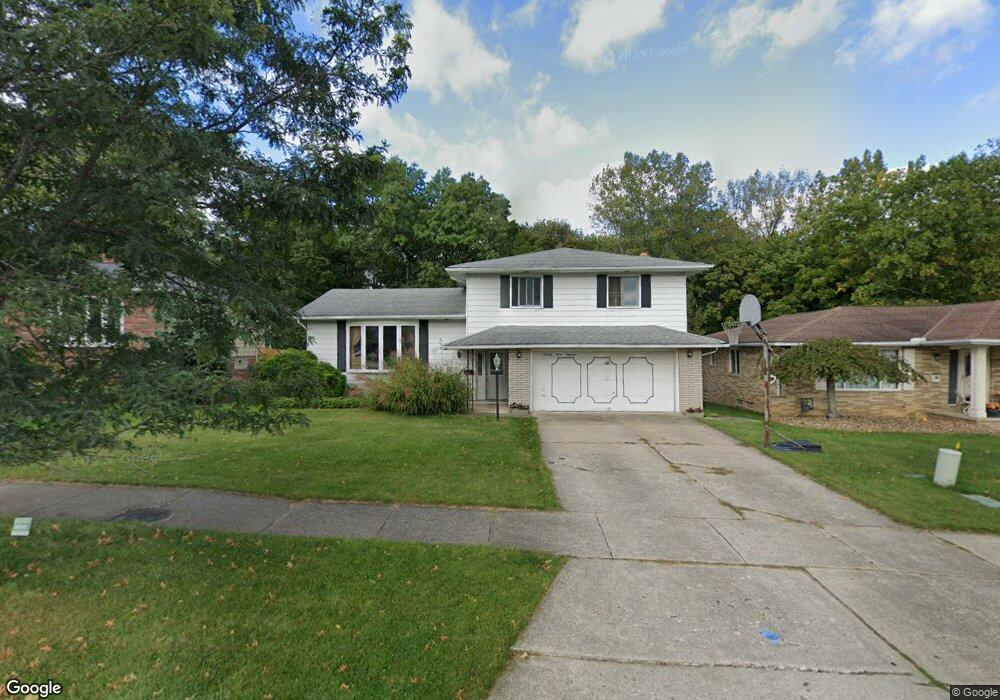
7300 Lancelot Dr Cleveland, OH 44134
Estimated Value: $279,000 - $321,000
4
Beds
2
Baths
2,020
Sq Ft
$147/Sq Ft
Est. Value
About This Home
This home is located at 7300 Lancelot Dr, Cleveland, OH 44134 and is currently estimated at $297,408, approximately $147 per square foot. 7300 Lancelot Dr is a home located in Cuyahoga County with nearby schools including Dentzler Elementary School, Normandy High School, and Hillside Middle School.
Ownership History
Date
Name
Owned For
Owner Type
Purchase Details
Closed on
Jul 5, 2006
Sold by
Lombardo Tony and Lombardo Lisa
Bought by
Ochocki Gregory J
Current Estimated Value
Home Financials for this Owner
Home Financials are based on the most recent Mortgage that was taken out on this home.
Original Mortgage
$170,773
Outstanding Balance
$101,552
Interest Rate
6.68%
Mortgage Type
FHA
Estimated Equity
$195,856
Purchase Details
Closed on
Mar 27, 2003
Sold by
Lanzo Thomas R
Bought by
Lombardo Tony and Lombardo Lisa
Home Financials for this Owner
Home Financials are based on the most recent Mortgage that was taken out on this home.
Original Mortgage
$140,250
Interest Rate
7.5%
Purchase Details
Closed on
Dec 27, 1977
Sold by
Cozza John C
Bought by
Lanzo Thomas R
Purchase Details
Closed on
Dec 27, 1976
Bought by
Cozza John C
Purchase Details
Closed on
Jan 1, 1976
Bought by
Earle Bldg Co
Create a Home Valuation Report for This Property
The Home Valuation Report is an in-depth analysis detailing your home's value as well as a comparison with similar homes in the area
Home Values in the Area
Average Home Value in this Area
Purchase History
| Date | Buyer | Sale Price | Title Company |
|---|---|---|---|
| Ochocki Gregory J | $173,500 | Land Title Group | |
| Lombardo Tony | $165,000 | -- | |
| Lanzo Thomas R | $66,900 | -- | |
| Cozza John C | $57,900 | -- | |
| Earle Bldg Co | -- | -- |
Source: Public Records
Mortgage History
| Date | Status | Borrower | Loan Amount |
|---|---|---|---|
| Open | Ochocki Gregory J | $170,773 | |
| Previous Owner | Lombardo Tony | $140,250 |
Source: Public Records
Tax History Compared to Growth
Tax History
| Year | Tax Paid | Tax Assessment Tax Assessment Total Assessment is a certain percentage of the fair market value that is determined by local assessors to be the total taxable value of land and additions on the property. | Land | Improvement |
|---|---|---|---|---|
| 2024 | $4,910 | $81,935 | $14,805 | $67,130 |
| 2023 | $5,104 | $74,170 | $13,230 | $60,940 |
| 2022 | $5,058 | $74,170 | $13,230 | $60,940 |
| 2021 | $5,211 | $74,170 | $13,230 | $60,940 |
| 2020 | $4,611 | $57,930 | $10,330 | $47,600 |
| 2019 | $5,051 | $165,500 | $29,500 | $136,000 |
| 2018 | $4,468 | $57,930 | $10,330 | $47,600 |
| 2017 | $4,464 | $54,190 | $8,650 | $45,540 |
| 2016 | $4,436 | $54,190 | $8,650 | $45,540 |
| 2015 | $4,398 | $54,190 | $8,650 | $45,540 |
| 2014 | $4,398 | $55,870 | $8,930 | $46,940 |
Source: Public Records
Map
Nearby Homes
- 2644 Nottingham Dr
- 1881 W Pleasant Valley Rd
- 7180 Marko Ln
- 2800 Bonny Blvd
- 3200 Dentzler Rd
- 2838 Marda Dr
- 375 Hillside Rd
- 1658 Winterpark Dr
- 3195 Marda Dr
- 2830 Brian Dr
- 1030 Guadalupe Dr
- 7558 Pleasant View Dr
- 7004 Broadview Rd
- 3262 Marda Dr
- 3011 Klusner Ave
- 7744 Cecelia Dr
- 223 Village Dr W
- 2406 Park Dr
- 2410 Park Dr
- 3610 Jeanne Dr
- 7296 Lancelot Dr
- 7310 Lancelot Dr
- 7320 Lancelot Dr
- 7292 Lancelot Dr
- 7330 Lancelot Dr
- 7288 Lancelot Dr
- 2224 Camelot Dr
- 7299 Lancelot Dr
- 7295 Lancelot Dr
- 7340 Lancelot Dr
- 2218 Camelot Dr
- 7284 Lancelot Dr
- 7291 Lancelot Dr
- 7350 Lancelot Dr
- 2212 Camelot Dr
- 7280 Lancelot Dr
- 2209 Avalon Dr
- 7281 Lancelot Dr
- 2223 Camelot Dr
- 7360 Lancelot Dr