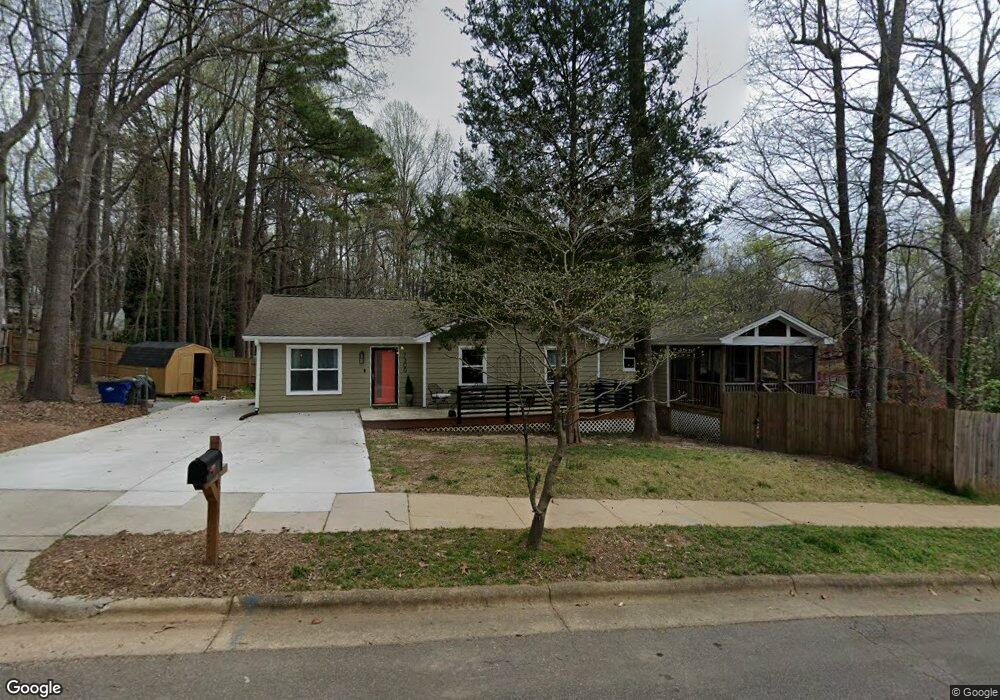
7300 Post Oak Rd Raleigh, NC 27615
North Hills NeighborhoodEstimated Value: $399,000 - $427,000
4
Beds
3
Baths
1,673
Sq Ft
$250/Sq Ft
Est. Value
About This Home
This home is located at 7300 Post Oak Rd, Raleigh, NC 27615 and is currently estimated at $418,464, approximately $250 per square foot. 7300 Post Oak Rd is a home located in Wake County with nearby schools including Lynn Road Elementary School, Carroll Middle, and Sanderson High School.
Ownership History
Date
Name
Owned For
Owner Type
Purchase Details
Closed on
May 18, 2021
Sold by
Wilks Christine A
Bought by
Wilks Christine A and The Christine A Wilks Living T
Current Estimated Value
Home Financials for this Owner
Home Financials are based on the most recent Mortgage that was taken out on this home.
Original Mortgage
$258,050
Outstanding Balance
$233,858
Interest Rate
3.1%
Mortgage Type
New Conventional
Estimated Equity
$184,606
Purchase Details
Closed on
Apr 21, 2020
Sold by
Carberry Kenneth T and Carberry Maria R
Bought by
Wilks Christine A and Christine A Wilks Living Trust
Home Financials for this Owner
Home Financials are based on the most recent Mortgage that was taken out on this home.
Original Mortgage
$257,050
Interest Rate
3.3%
Mortgage Type
New Conventional
Purchase Details
Closed on
Nov 16, 1982
Bought by
Carberry Kenneth T and Carberry Maria R
Create a Home Valuation Report for This Property
The Home Valuation Report is an in-depth analysis detailing your home's value as well as a comparison with similar homes in the area
Home Values in the Area
Average Home Value in this Area
Purchase History
| Date | Buyer | Sale Price | Title Company |
|---|---|---|---|
| Wilks Christine A | -- | None Available | |
| Wilks Christine A | -- | Amrock | |
| Wilks Christine A | $265,000 | None Available | |
| Carberry Kenneth T | $51,500 | -- |
Source: Public Records
Mortgage History
| Date | Status | Borrower | Loan Amount |
|---|---|---|---|
| Open | Wilks Christine A | $258,050 | |
| Closed | Wilks Christine A | $257,050 |
Source: Public Records
Tax History
| Year | Tax Paid | Tax Assessment Tax Assessment Total Assessment is a certain percentage of the fair market value that is determined by local assessors to be the total taxable value of land and additions on the property. | Land | Improvement |
|---|---|---|---|---|
| 2025 | $3,585 | $408,757 | $175,000 | $233,757 |
| 2024 | $3,570 | $408,757 | $175,000 | $233,757 |
Source: Public Records
Map
Nearby Homes
- 7260 Shellburne Dr
- 7271 Shellburne Dr
- 7313 Longstreet Dr
- 7121 Shellburne Dr
- 6840 Gloucester Rd
- 6844 Gloucester Rd
- 512 Smokeridge Ln
- 6514 Hearthstone Dr
- 7002 Longstreet Dr Unit C
- 6528 Hearthstone Dr
- 6410 English Oaks Dr
- 704 Benchmark Dr
- 7020 Longstreet Dr Unit A
- 812 Havenwood Ct
- 805 Havenwood Ct
- 717 Benchmark Dr
- 801 Genford Ct
- 800 Plentywood Ct
- 6825 Middleboro Dr
- 804 Plentywood Ct
- 7104 Tyndall Ct
- 7100 Tyndall Ct
- 7200 Stuart Dr
- 7309 Post Oak Rd
- 7301 Post Oak Rd
- 7204 Stuart Dr
- 7113 Tyndall Ct
- 7101 Tyndall Ct
- 7109 Tyndall Ct
- 7319 Post Oak Rd
- 7117 Tyndall Ct
- 7208 Stuart Dr
- 7315 Post Oak Rd
- 7116 Tyndall Ct
- 7105 Tyndall Ct
- 7121 Tyndall Ct
- 5728 Stuart Ridge Rd
- 7125 Tyndall Ct
- 7212 Stuart Dr
- 7120 Tyndall Ct
Your Personal Tour Guide
Ask me questions while you tour the home.