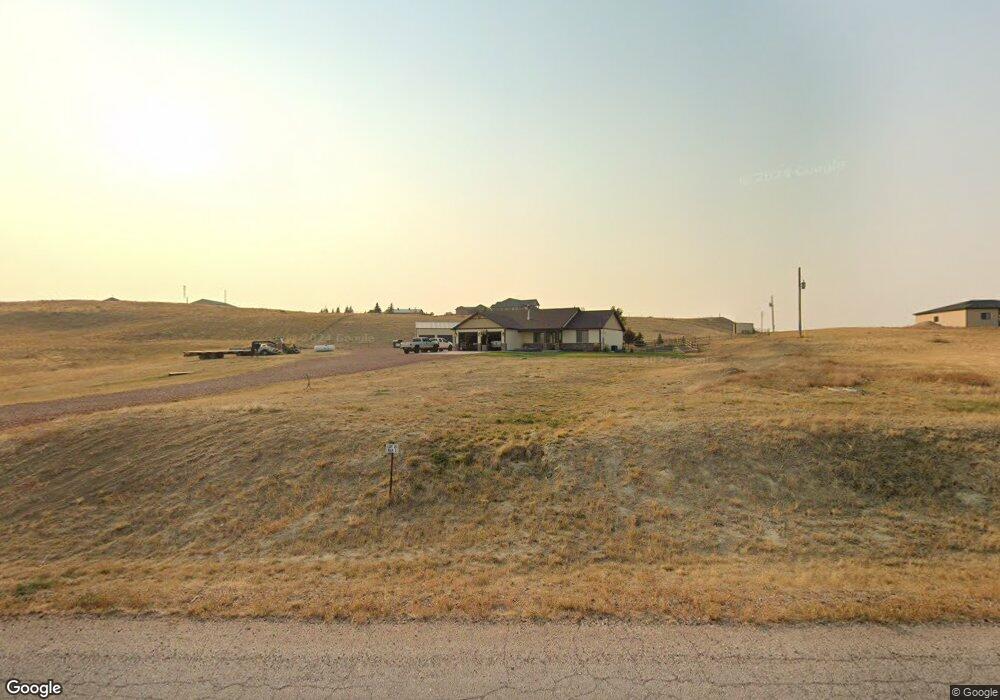
7300 Red Stone Rd Gillette, WY 82718
Estimated Value: $372,000 - $770,000
5
Beds
3
Baths
1,672
Sq Ft
$328/Sq Ft
Est. Value
About This Home
This home is located at 7300 Red Stone Rd, Gillette, WY 82718 and is currently estimated at $547,879, approximately $327 per square foot. 7300 Red Stone Rd is a home with nearby schools including Westwood High School, Pronghorn Elementary School, and Sage Valley Junior High School.
Ownership History
Date
Name
Owned For
Owner Type
Purchase Details
Closed on
May 9, 2023
Sold by
Bender Jeffrey L and Bender Kari A
Bought by
Kari A Bender Revocable Living Trust and Jeffrey L Bender Revocable Living Trust
Current Estimated Value
Purchase Details
Closed on
Aug 27, 2019
Sold by
Butler Jade and Butler Michelle
Bought by
Bender Jeffrey L and Bender Kari A
Home Financials for this Owner
Home Financials are based on the most recent Mortgage that was taken out on this home.
Original Mortgage
$394,250
Interest Rate
3.7%
Mortgage Type
New Conventional
Purchase Details
Closed on
May 21, 2015
Sold by
New Land Company Llc
Bought by
Heritage Homes
Create a Home Valuation Report for This Property
The Home Valuation Report is an in-depth analysis detailing your home's value as well as a comparison with similar homes in the area
Home Values in the Area
Average Home Value in this Area
Purchase History
| Date | Buyer | Sale Price | Title Company |
|---|---|---|---|
| Kari A Bender Revocable Living Trust | -- | None Listed On Document | |
| Bender Jeffrey L | -- | First American Title | |
| Heritage Homes | -- | None Available |
Source: Public Records
Mortgage History
| Date | Status | Borrower | Loan Amount |
|---|---|---|---|
| Previous Owner | Bender Jeffrey L | $394,250 |
Source: Public Records
Tax History Compared to Growth
Tax History
| Year | Tax Paid | Tax Assessment Tax Assessment Total Assessment is a certain percentage of the fair market value that is determined by local assessors to be the total taxable value of land and additions on the property. | Land | Improvement |
|---|---|---|---|---|
| 2025 | $3,570 | $45,161 | $7,316 | $37,845 |
| 2024 | $3,570 | $57,278 | $9,380 | $47,898 |
| 2023 | $3,479 | $55,799 | $7,909 | $47,890 |
| 2022 | $2,989 | $47,776 | $7,909 | $39,867 |
| 2021 | $2,226 | $44,475 | $8,207 | $36,268 |
| 2020 | $2,226 | $37,068 | $7,488 | $29,580 |
| 2019 | $1,993 | $33,273 | $7,488 | $25,785 |
| 2018 | $1,766 | $29,620 | $7,488 | $22,132 |
| 2017 | $1,965 | $33,045 | $7,838 | $25,207 |
| 2016 | $1,969 | $33,066 | $7,838 | $25,228 |
| 2015 | -- | $2,376 | $2,376 | $0 |
| 2014 | -- | $1,818 | $1,818 | $0 |
Source: Public Records
Map
Nearby Homes
- 7200 Red Stone Rd
- 6001 Stone Gate Ave
- 7350 Red Hills Rd
- 7500 Stone Crest Dr
- 3700 Sun Dancer Ct
- 6800 Force Rd
- 5101 Stone Ridge Ct
- 4390 Crestfield Ave
- Lot 13 Shiplap Spur
- 4111 Hidden Valley Rd
- 370 Wyoming 50
- 122 Lewis Rd
- 68 Box N Ranch Rd
- 4101 Mesa Verde Dr
- 4125 Overdale Dr
- 721 Sako Dr
- 704 Sako Dr
- 1805 W Four J Rd -
- 4301 Tate Ave
- 608 Express Dr
- 7400 Red Stone Rd
- 7250 Red Stone Rd
- 6000 Vantage Ct
- 7301 Red Stone Rd
- 7405 Red Stone Rd
- 7201 Red Stone Rd
- 7500 Red Stone Rd
- 5900 Vantage Ct
- 5751 Red Hills Rd
- 5851 Red Hills Rd
- 6001 Red Hills Rd
- 7195 Red Stone Rd
- 6001 Vantage Ct
- Tbd Vantage Ct
- 5601 Red Hills Rd
- 5885 Red Hills Rd
- 5451 Red Hills Rd
- 5851 Vantage Ct -
- 5401 Red Hills Rd
- 5901 Vantage Ct