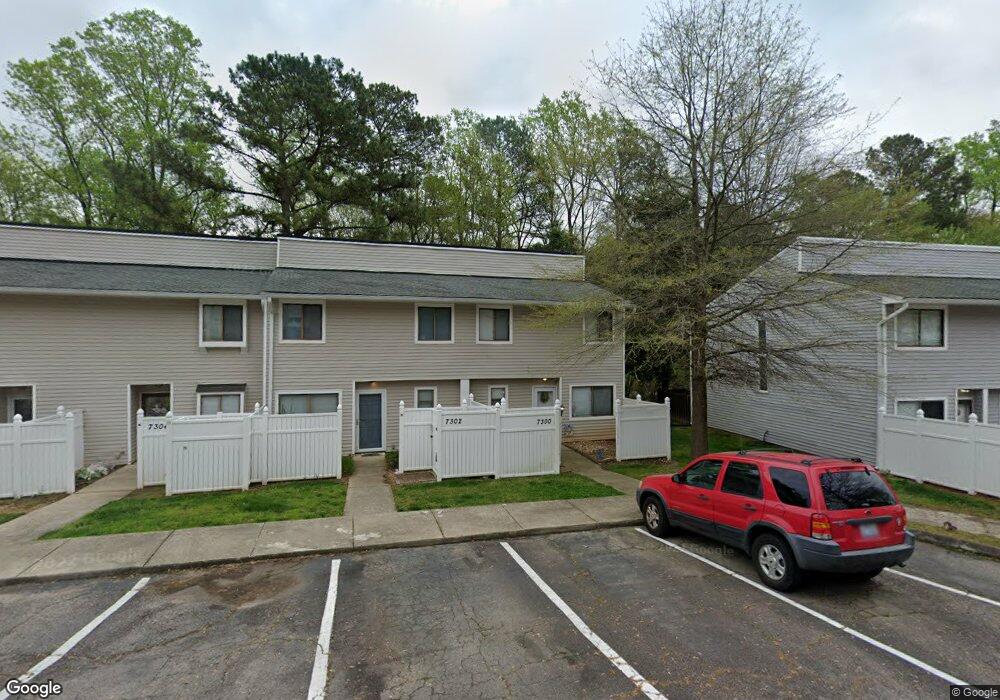
7300 Sandy Creek Dr Unit 1 Raleigh, NC 27615
Six Forks NeighborhoodEstimated Value: $218,000 - $244,000
3
Beds
3
Baths
1,395
Sq Ft
$169/Sq Ft
Est. Value
About This Home
This home is located at 7300 Sandy Creek Dr Unit 1, Raleigh, NC 27615 and is currently estimated at $235,215, approximately $168 per square foot. 7300 Sandy Creek Dr Unit 1 is a home located in Wake County with nearby schools including Pleasant Union Elementary School, West Millbrook Middle School, and Sanderson High School.
Ownership History
Date
Name
Owned For
Owner Type
Purchase Details
Closed on
Jun 27, 2011
Sold by
Conroy Carrie
Bought by
Mugeni Wambeti
Current Estimated Value
Home Financials for this Owner
Home Financials are based on the most recent Mortgage that was taken out on this home.
Original Mortgage
$93,078
Interest Rate
4.37%
Mortgage Type
FHA
Purchase Details
Closed on
Feb 21, 2003
Sold by
The Bank Of New York
Bought by
Conroy Carrie Sue
Home Financials for this Owner
Home Financials are based on the most recent Mortgage that was taken out on this home.
Original Mortgage
$67,700
Interest Rate
5.93%
Purchase Details
Closed on
Feb 19, 2003
Sold by
Sandy Creek Condominium Assn Inc
Bought by
Conroy Carrie Sue
Home Financials for this Owner
Home Financials are based on the most recent Mortgage that was taken out on this home.
Original Mortgage
$67,700
Interest Rate
5.93%
Purchase Details
Closed on
Jun 24, 2002
Sold by
Ellison Peter and Ellison Rachael
Bought by
The Bank Of New York Tr
Create a Home Valuation Report for This Property
The Home Valuation Report is an in-depth analysis detailing your home's value as well as a comparison with similar homes in the area
Home Values in the Area
Average Home Value in this Area
Purchase History
| Date | Buyer | Sale Price | Title Company |
|---|---|---|---|
| Mugeni Wambeti | $95,500 | Market Title Company | |
| Conroy Carrie Sue | $68,000 | -- | |
| Conroy Carrie Sue | -- | -- | |
| The Bank Of New York Tr | $75,105 | -- |
Source: Public Records
Mortgage History
| Date | Status | Borrower | Loan Amount |
|---|---|---|---|
| Previous Owner | Mugeni Wambeti | $93,078 | |
| Previous Owner | Conroy Carrie Sue | $67,700 |
Source: Public Records
Tax History Compared to Growth
Tax History
| Year | Tax Paid | Tax Assessment Tax Assessment Total Assessment is a certain percentage of the fair market value that is determined by local assessors to be the total taxable value of land and additions on the property. | Land | Improvement |
|---|---|---|---|---|
| 2025 | $2,172 | $246,785 | -- | $246,785 |
| 2024 | $2,163 | $246,785 | $0 | $246,785 |
| 2023 | $1,360 | $143,299 | $0 | $143,299 |
| 2022 | $1,265 | $143,299 | $0 | $143,299 |
| 2021 | $1,414 | $143,299 | $0 | $143,299 |
| 2020 | $1,320 | $143,299 | $0 | $143,299 |
| 2019 | $1,115 | $100,026 | $0 | $100,026 |
| 2018 | $1,052 | $100,026 | $0 | $100,026 |
| 2017 | $1,003 | $100,026 | $0 | $100,026 |
| 2016 | $1,039 | $100,026 | $0 | $100,026 |
| 2015 | $1,066 | $100,978 | $0 | $100,978 |
| 2014 | -- | $100,978 | $0 | $100,978 |
Source: Public Records
Map
Nearby Homes
- 7320 Sandy Creek Dr
- 7719 Kelley Ct Unit 314E
- 7729 Bernadette Ln Unit 322B
- 232 Wetherburn Ln
- 204 Bracken Ct
- 213 Bracken Ct
- 7412 Penny Hill Ln
- 800 Plentywood Ct
- 812 Havenwood Ct
- 7715 Kingsberry Ct
- 7329 Bonnie Ridge Ct
- 7731 Kingsberry Ct
- 7046 Longstreet Dr Unit C
- 7020 Longstreet Dr Unit A
- 7124 Longstreet Dr
- 7002 Longstreet Dr Unit C
- 7108 Longstreet Dr Unit A
- 119 Yorkchester Way
- 136 Yorkchester Way
- 8009 Running Cedar Trail
- 7302 Sandy Creek Dr Unit P2
- 7302 Sandy Creek Dr
- 7304 Sandy Creek Dr
- 7304 Sandy Creek Dr Unit 1
- 7231 Sandy Creek Dr Unit N7
- 7306 Sandy Creek Dr Unit P4
- 7233 Sandy Creek Dr
- 7308 Sandy Creek Dr
- 7308 Sandy Creek Dr Unit 5
- 7235 Sandy Creek Dr
- 7235 Sandy Creek Dr
- 7310 Sandy Creek Dr Unit P6
- 7237 Sandy Creek Dr Unit N4
- 7312 Sandy Creek Dr Unit P7
- 7312 Sandy Creek Dr Unit 7
- 7239 Sandy Creek Dr
- 7314 Sandy Creek Dr
- 7314 Sandy Creek Dr Unit P8
- 7314 Sandy Creek Dr Unit 1
- 7241 Sandy Creek Dr Unit N2