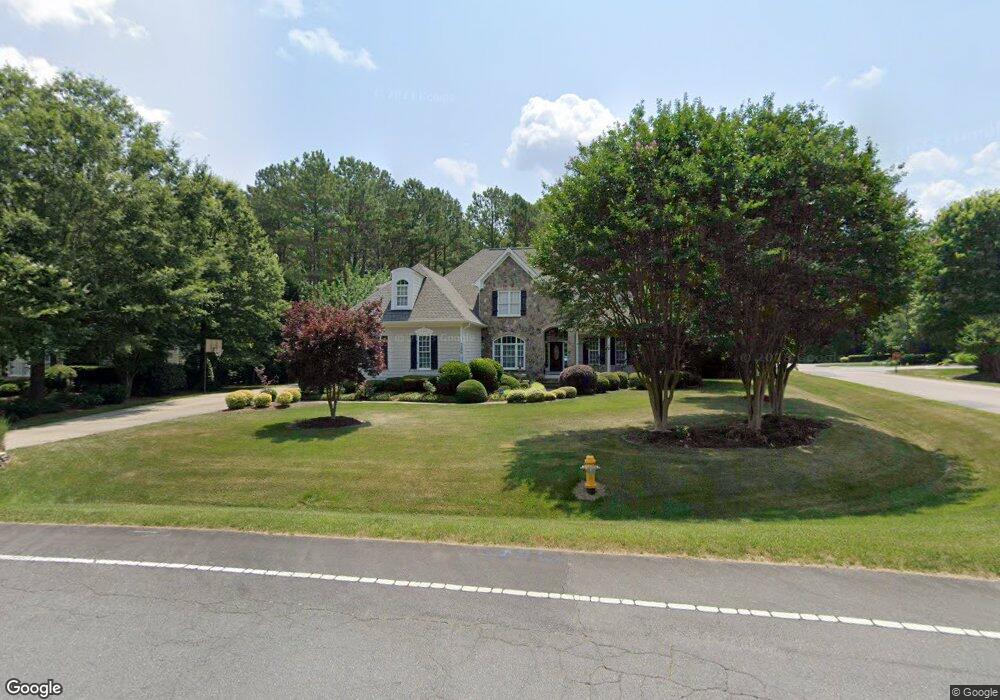
7300 Sparhawk Rd Wake Forest, NC 27587
Falls Lake NeighborhoodEstimated Value: $986,000 - $1,109,000
4
Beds
4
Baths
3,710
Sq Ft
$280/Sq Ft
Est. Value
About This Home
This home is located at 7300 Sparhawk Rd, Wake Forest, NC 27587 and is currently estimated at $1,037,603, approximately $279 per square foot. 7300 Sparhawk Rd is a home located in Wake County with nearby schools including Richland Creek Elementary School, Wake Forest-Rolesville Middle School, and Wake Forest High School.
Ownership History
Date
Name
Owned For
Owner Type
Purchase Details
Closed on
Jun 30, 2010
Sold by
Dodd John and Dodd Donna
Bought by
Strickland Roger Privette and Strickland Carole D
Current Estimated Value
Purchase Details
Closed on
Sep 28, 2004
Sold by
John T Ryan Custom Homes Inc
Bought by
Dodd John and Dodd Donna
Home Financials for this Owner
Home Financials are based on the most recent Mortgage that was taken out on this home.
Original Mortgage
$330,000
Interest Rate
5.73%
Mortgage Type
Purchase Money Mortgage
Purchase Details
Closed on
Oct 9, 2003
Sold by
St Ives Llc
Bought by
John T Ryan Custom Homes Inc
Home Financials for this Owner
Home Financials are based on the most recent Mortgage that was taken out on this home.
Original Mortgage
$425,920
Interest Rate
6.45%
Mortgage Type
Purchase Money Mortgage
Create a Home Valuation Report for This Property
The Home Valuation Report is an in-depth analysis detailing your home's value as well as a comparison with similar homes in the area
Home Values in the Area
Average Home Value in this Area
Purchase History
| Date | Buyer | Sale Price | Title Company |
|---|---|---|---|
| Strickland Roger Privette | $580,000 | None Available | |
| Dodd John | $533,000 | -- | |
| John T Ryan Custom Homes Inc | $94,000 | -- |
Source: Public Records
Mortgage History
| Date | Status | Borrower | Loan Amount |
|---|---|---|---|
| Previous Owner | Dodd John | $330,000 | |
| Previous Owner | John T Ryan Custom Homes Inc | $425,920 |
Source: Public Records
Tax History Compared to Growth
Tax History
| Year | Tax Paid | Tax Assessment Tax Assessment Total Assessment is a certain percentage of the fair market value that is determined by local assessors to be the total taxable value of land and additions on the property. | Land | Improvement |
|---|---|---|---|---|
| 2025 | $9,903 | $1,029,979 | $270,000 | $759,979 |
| 2024 | $9,866 | $1,029,979 | $270,000 | $759,979 |
| 2023 | $6,925 | $594,200 | $110,000 | $484,200 |
| 2022 | $6,642 | $594,200 | $110,000 | $484,200 |
| 2021 | $6,526 | $594,200 | $110,000 | $484,200 |
| 2020 | $6,526 | $594,200 | $110,000 | $484,200 |
| 2019 | $7,172 | $576,441 | $156,000 | $420,441 |
| 2018 | $6,790 | $576,441 | $156,000 | $420,441 |
| 2017 | $6,563 | $576,441 | $156,000 | $420,441 |
| 2016 | $6,479 | $576,441 | $156,000 | $420,441 |
| 2015 | $7,374 | $648,184 | $110,000 | $538,184 |
| 2014 | $7,137 | $648,184 | $110,000 | $538,184 |
Source: Public Records
Map
Nearby Homes
- 7328 Sparhawk Rd
- 2957 Wexford Pond Way
- 7932 Wexford Waters Ln
- 2808 Wexford Forest Ln
- 2800 Wexford Forest Ln
- 7805 Ailesbury Rd
- 235 Capellan St
- 8008 Wexford Waters Ln
- 7813 Ailesbury Rd
- 2428 Rachel Dr
- 2508 Kearney Rd
- 7961 Wexford Waters Ln
- 7956 Wexford Waters Ln
- 2928 Wexford Pond Way
- 7312 Wexford Woods Ln
- 8000 Wexford Waters Ln
- 7317 Wexford Woods Ln
- 1132 Barred Owl Trail
- 2725 Trifle Ln
- 7609 Thompson Mill Rd
- 7304 Sparhawk Rd
- 509 Capellan St
- 7248 Sparhawk Rd
- 7301 Sparhawk Rd
- 7308 Sparhawk Rd
- 504 Capellan St
- 7305 Sparhawk Rd
- 7244 Sparhawk Rd
- 7225 Sparhawk Rd
- 7309 Sparhawk Rd
- 7312 Sparhawk Rd
- 7240 Sparhawk Rd
- 7221 Sparhawk Rd
- 500 Capellan St
- 412 Deep Woods Trail
- 408 Deep Woods Trail
- 408 Deep Woods Trail Unit 53
- 7316 Sparhawk Rd
- 1209 Winkworth Way
- 7313 Sparhawk Rd