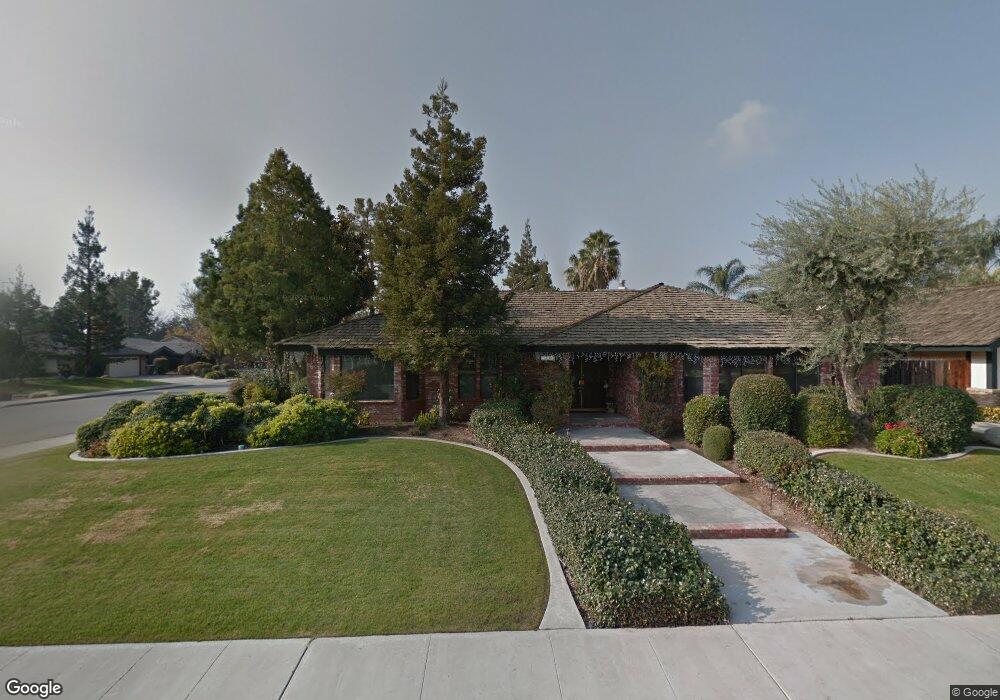
7301 Canada Ct Bakersfield, CA 93308
Olive Drive Area NeighborhoodEstimated Value: $550,377 - $565,000
4
Beds
3
Baths
2,430
Sq Ft
$229/Sq Ft
Est. Value
About This Home
This home is located at 7301 Canada Ct, Bakersfield, CA 93308 and is currently estimated at $556,594, approximately $229 per square foot. 7301 Canada Ct is a home located in Kern County with nearby schools including Olive Drive Elementary School, Norris Middle School, and Centennial High School.
Ownership History
Date
Name
Owned For
Owner Type
Purchase Details
Closed on
Mar 20, 2012
Sold by
Summers Deanna L
Bought by
Summers Deanna L and Summers Terry L
Current Estimated Value
Home Financials for this Owner
Home Financials are based on the most recent Mortgage that was taken out on this home.
Original Mortgage
$195,200
Outstanding Balance
$134,025
Interest Rate
3.86%
Mortgage Type
New Conventional
Estimated Equity
$422,569
Purchase Details
Closed on
Mar 25, 2003
Sold by
Summers Terry Leon
Bought by
Summers Deanna L
Home Financials for this Owner
Home Financials are based on the most recent Mortgage that was taken out on this home.
Original Mortgage
$163,750
Interest Rate
5.73%
Mortgage Type
Purchase Money Mortgage
Purchase Details
Closed on
Jun 25, 2002
Sold by
Tackett Kent A
Bought by
Tackett Deanna L
Create a Home Valuation Report for This Property
The Home Valuation Report is an in-depth analysis detailing your home's value as well as a comparison with similar homes in the area
Home Values in the Area
Average Home Value in this Area
Purchase History
| Date | Buyer | Sale Price | Title Company |
|---|---|---|---|
| Summers Deanna L | -- | Ticor Title Company Of Ca | |
| Summers Deanna L | -- | Stewart Title | |
| Tackett Deanna L | -- | -- |
Source: Public Records
Mortgage History
| Date | Status | Borrower | Loan Amount |
|---|---|---|---|
| Open | Summers Deanna L | $195,200 | |
| Closed | Summers Deanna L | $163,750 |
Source: Public Records
Tax History
| Year | Tax Paid | Tax Assessment Tax Assessment Total Assessment is a certain percentage of the fair market value that is determined by local assessors to be the total taxable value of land and additions on the property. | Land | Improvement |
|---|---|---|---|---|
| 2025 | $4,486 | $337,431 | $65,059 | $272,372 |
| 2024 | $4,404 | $330,817 | $63,784 | $267,033 |
| 2023 | $4,404 | $324,332 | $62,534 | $261,798 |
| 2022 | $4,330 | $317,974 | $61,308 | $256,666 |
| 2021 | $4,243 | $311,740 | $60,106 | $251,634 |
| 2020 | $4,126 | $308,545 | $59,490 | $249,055 |
| 2019 | $4,068 | $308,545 | $59,490 | $249,055 |
| 2018 | $3,938 | $296,567 | $57,181 | $239,386 |
| 2017 | $3,958 | $290,753 | $56,060 | $234,693 |
| 2016 | $3,684 | $285,053 | $54,961 | $230,092 |
| 2015 | $3,621 | $280,773 | $54,136 | $226,637 |
| 2014 | $3,540 | $275,275 | $53,076 | $222,199 |
Source: Public Records
Map
Nearby Homes
- 7712 Jensen Ave
- 7108 Luke Ave
- 7221 Etter St
- 7009 Etter St
- 7919 Scarlet Maple Ct
- 6900 Jennifer St
- 7233 Fountain Valley Dr
- 6801 Mignonette St
- 6712 Noah Ave
- 7207 Briar Ridge Ct
- 7704 Jill Jean Ave
- 6413 Gina Ct
- 6708 Cranbrook Ave
- 6600 Audene Way
- 7908 Jill Jean Ave
- 8302 Jean Anne St
- 6709 Cedarcrest Ave
- 8400 Jean Anne St
- 6505 Joe Ed Way
- 6600 Cedarcrest Ave
- 7305 Canada Ct
- 7300 Rams St
- 7304 Rams St
- 7501 Lovetta Dr
- 7505 Lovetta Dr
- 7309 Canada Ct
- 7413 Lovetta Dr
- 7300 Canada Ct
- 7308 Rams St
- 7304 Canada Ct
- 7509 Lovetta Dr
- 7313 Canada Ct
- 7409 Lovetta Dr
- 7312 Rams St
- 7308 Canada Ct
- 7312 Canada Ct
- 7513 Lovetta Dr
- 7500 Olcott Ave
- 7504 Olcott Ave
- 7600 Lovetta Dr
Your Personal Tour Guide
Ask me questions while you tour the home.