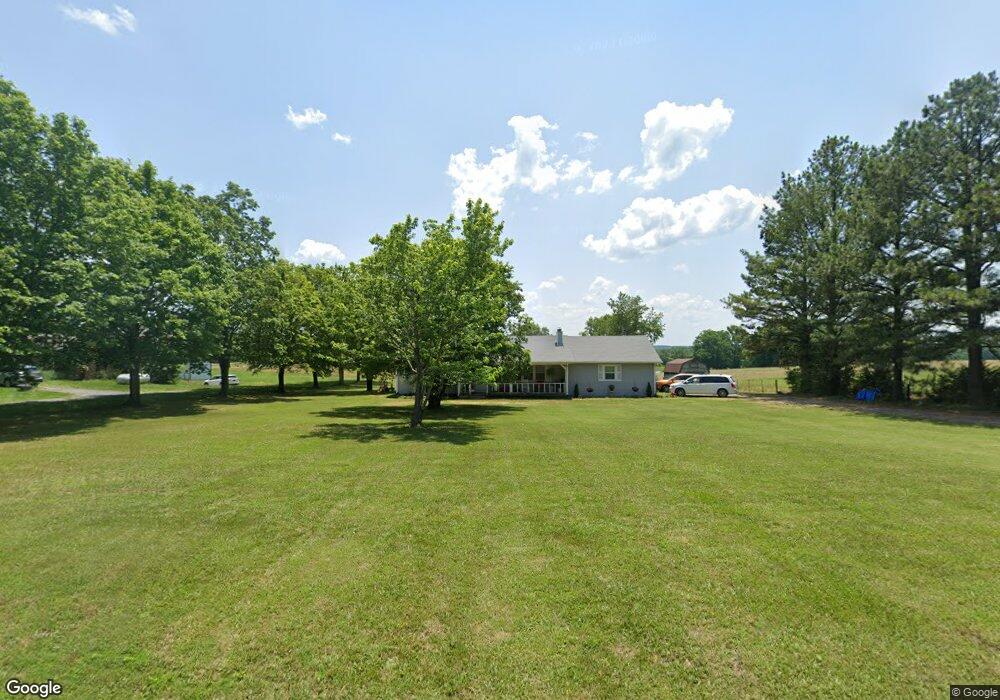
7301 Doug Hill Rd Bon Aqua, TN 37025
Estimated Value: $351,065 - $843,000
--
Bed
2
Baths
2,070
Sq Ft
$252/Sq Ft
Est. Value
About This Home
This home is located at 7301 Doug Hill Rd, Bon Aqua, TN 37025 and is currently estimated at $522,516, approximately $252 per square foot. 7301 Doug Hill Rd is a home located in Williamson County with nearby schools including Fairview Elementary School, Fairview Middle School, and Fairview High School.
Ownership History
Date
Name
Owned For
Owner Type
Purchase Details
Closed on
Dec 23, 2010
Sold by
Harris Jerry and Harris Eva W
Bought by
Hartley Kyle
Current Estimated Value
Home Financials for this Owner
Home Financials are based on the most recent Mortgage that was taken out on this home.
Original Mortgage
$122,580
Outstanding Balance
$81,807
Interest Rate
4.42%
Mortgage Type
VA
Estimated Equity
$440,709
Purchase Details
Closed on
Sep 6, 2001
Sold by
Harris Jeremy and Harris Sharon
Bought by
Harris Jerry and Harris Eva W
Home Financials for this Owner
Home Financials are based on the most recent Mortgage that was taken out on this home.
Original Mortgage
$85,000
Interest Rate
6.89%
Mortgage Type
Purchase Money Mortgage
Purchase Details
Closed on
Aug 27, 1999
Sold by
First National Bank Of Chicago
Bought by
Harris Jeremy and Harris Jerry
Purchase Details
Closed on
Jan 11, 1999
Sold by
Woodard Cecil and Woodard Dorothy
Bought by
First National Bank Of Chicago
Purchase Details
Closed on
May 16, 1997
Sold by
Eastep Barbara W
Bought by
Woodad and Dorothy
Purchase Details
Closed on
Oct 3, 1996
Sold by
Brooks Delana C
Bought by
Eastep Barbara W
Create a Home Valuation Report for This Property
The Home Valuation Report is an in-depth analysis detailing your home's value as well as a comparison with similar homes in the area
Home Values in the Area
Average Home Value in this Area
Purchase History
| Date | Buyer | Sale Price | Title Company |
|---|---|---|---|
| Hartley Kyle | $120,000 | Realty Title | |
| Harris Jerry | -- | Rudy Title & Escrow | |
| Harris Jeremy | $119,000 | Wilson & Weiss Title Associa | |
| First National Bank Of Chicago | $93,344 | -- | |
| Woodad | $115,000 | -- | |
| Eastep Barbara W | $79,000 | -- |
Source: Public Records
Mortgage History
| Date | Status | Borrower | Loan Amount |
|---|---|---|---|
| Open | Hartley Kyle | $122,580 | |
| Previous Owner | Harris Jerry | $85,000 |
Source: Public Records
Tax History Compared to Growth
Tax History
| Year | Tax Paid | Tax Assessment Tax Assessment Total Assessment is a certain percentage of the fair market value that is determined by local assessors to be the total taxable value of land and additions on the property. | Land | Improvement |
|---|---|---|---|---|
| 2025 | $948 | $70,325 | $29,100 | $41,225 |
| 2024 | $948 | $50,425 | $15,175 | $35,250 |
| 2023 | $948 | $50,425 | $15,175 | $35,250 |
| 2022 | $948 | $50,425 | $15,175 | $35,250 |
| 2021 | $948 | $50,425 | $15,175 | $35,250 |
| 2020 | $850 | $38,300 | $9,375 | $28,925 |
| 2019 | $850 | $38,300 | $9,375 | $28,925 |
| 2018 | $823 | $38,300 | $9,375 | $28,925 |
| 2017 | $823 | $38,300 | $9,375 | $28,925 |
| 2016 | $823 | $38,300 | $9,375 | $28,925 |
| 2015 | -- | $32,550 | $6,275 | $26,275 |
| 2014 | -- | $32,550 | $6,275 | $26,275 |
Source: Public Records
Map
Nearby Homes
- 7303 Dug Hill Rd
- 7329 Old Cox Pike
- 7231 Old Cox Pike
- 0 Crow Cut Rd NW
- 7371 Sugar Camp Hollow Rd
- 7402 Black Fox Dr
- 7404 Black Fox Dr
- 7406 Black Fox Dr
- 7413 Black Fox Dr
- 7412 Black Fox Dr
- 7408 Black Fox Dr
- 7329 Buckhorn Ct
- 7343 Buckhorn Ct
- 7324 Buckhorn Ct
- 7336 Buckhorn Ct
- 7326 Buckhorn Ct
- 7338 Buckhorn Ct
- 7301 Buckhorn Ct
- Carlton Plan at Aden Woods of Castleberry Farms
- Williamsburg Plan at Aden Woods of Castleberry Farms
- 7603 Crow Cut Rd
- 7611 Crow Cut Rd
- 7595 Crow Cut Rd Unit 7597
- 7615 Crow Cut Rd
- 7289 Old Cox Pike
- 7588 Crow Cut Rd
- 7284 Old Cox Pike
- 7263 Old Cox Pike
- 7268 Old Cox Pike
- 7308 Dug Hill Rd
- 7274 Old Cox Pike
- 7592 Crow Cut Rd
- 7584 Crow Cut Rd
- 7590 Crow Cut Rd
- 7617 Crow Cut Rd
- 7325 Old Cox Pike
- 7251 Old Cox Pike
- 7260 Old Cox Pike
- 7569 Crow Cut Rd
- 7305 Doug Hill Rd