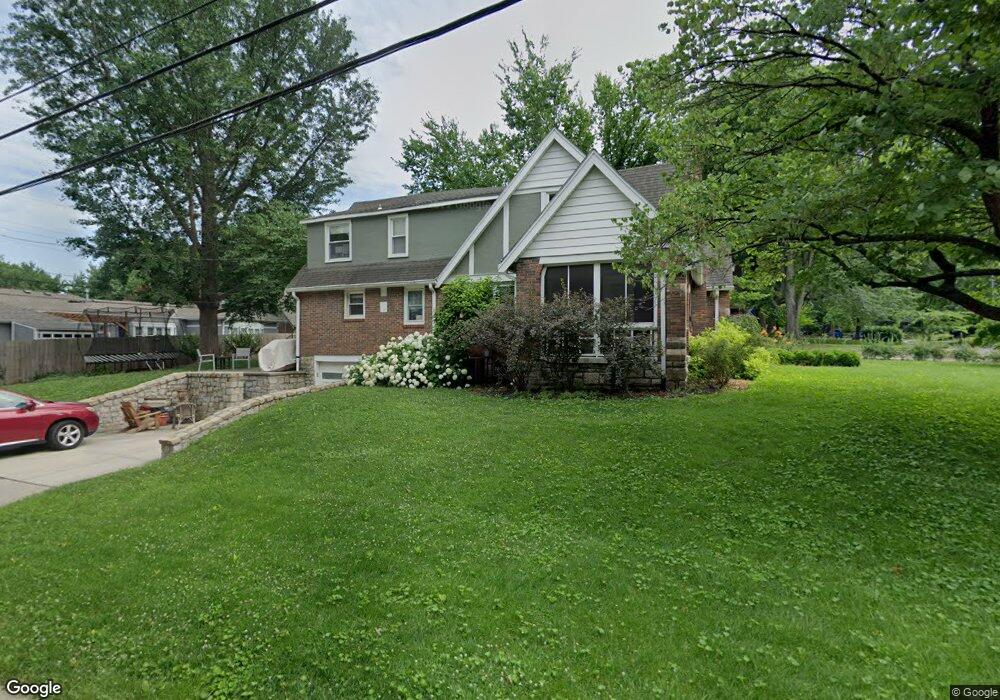
7301 Terrace St Kansas City, MO 64114
Waldo NeighborhoodEstimated Value: $498,000 - $577,254
3
Beds
2
Baths
2,340
Sq Ft
$232/Sq Ft
Est. Value
About This Home
This home is located at 7301 Terrace St, Kansas City, MO 64114 and is currently estimated at $543,814, approximately $232 per square foot. 7301 Terrace St is a home located in Jackson County with nearby schools including Hale Cook Elementary, Central Middle School, and Southeast High School.
Ownership History
Date
Name
Owned For
Owner Type
Purchase Details
Closed on
Jan 25, 2012
Sold by
Himes Stephen and Himes Franci Erdman
Bought by
Himes Stephen and Himes Franci Erdman
Current Estimated Value
Home Financials for this Owner
Home Financials are based on the most recent Mortgage that was taken out on this home.
Original Mortgage
$188,752
Outstanding Balance
$20,766
Interest Rate
3.27%
Mortgage Type
New Conventional
Estimated Equity
$523,048
Purchase Details
Closed on
Oct 1, 2009
Sold by
Lefevre David L and Lefevre Kindra M
Bought by
Himes Stephen and Erdmann Franci
Home Financials for this Owner
Home Financials are based on the most recent Mortgage that was taken out on this home.
Original Mortgage
$196,377
Interest Rate
5.14%
Mortgage Type
FHA
Purchase Details
Closed on
Dec 30, 2008
Sold by
Watkins Janet Sloan and Watkins David G
Bought by
Lefevre David L and Lefevre Kindra M
Create a Home Valuation Report for This Property
The Home Valuation Report is an in-depth analysis detailing your home's value as well as a comparison with similar homes in the area
Home Values in the Area
Average Home Value in this Area
Purchase History
| Date | Buyer | Sale Price | Title Company |
|---|---|---|---|
| Himes Stephen | -- | Coffelt Land Title Inc | |
| Himes Stephen | -- | First American Title | |
| Lefevre David L | -- | Kansas City Title |
Source: Public Records
Mortgage History
| Date | Status | Borrower | Loan Amount |
|---|---|---|---|
| Open | Himes Stephen | $188,752 | |
| Closed | Himes Stephen | $196,377 |
Source: Public Records
Tax History Compared to Growth
Tax History
| Year | Tax Paid | Tax Assessment Tax Assessment Total Assessment is a certain percentage of the fair market value that is determined by local assessors to be the total taxable value of land and additions on the property. | Land | Improvement |
|---|---|---|---|---|
| 2025 | $7,385 | $105,524 | $26,435 | $79,089 |
| 2024 | $7,315 | $93,566 | $31,194 | $62,372 |
| 2023 | $7,315 | $93,565 | $14,210 | $79,355 |
| 2022 | $7,330 | $89,110 | $17,828 | $71,282 |
| 2021 | $7,305 | $89,110 | $17,828 | $71,282 |
| 2020 | $6,490 | $78,175 | $17,828 | $60,347 |
| 2019 | $6,355 | $78,175 | $17,828 | $60,347 |
| 2018 | $3,493 | $43,882 | $7,753 | $36,129 |
| 2017 | $3,266 | $43,882 | $7,753 | $36,129 |
| 2016 | $3,266 | $40,804 | $7,516 | $33,288 |
| 2014 | $3,212 | $40,005 | $7,369 | $32,636 |
Source: Public Records
Map
Nearby Homes
- 7251 Terrace St
- 1245 W 72nd St
- 7416 Belleview Ave
- 2004 W 72nd Terrace
- 7217 Madison Ave
- 826 W 75th St
- 7615 Terrace St
- 2207 W 71st St
- 1127 W 76th Terrace
- 7135 Jefferson St
- 701 W Gregory Blvd
- 2300 W 71st Terrace
- 707 W 75th Terrace
- 7515 Jefferson St
- 7620 Ward Pkwy
- 704 W 76th St
- 1911 Romany Rd
- 7305 Washington St
- 7328 Booth St
- 1012 W 69th Terrace
- 7309 Terrace St
- 7300 Terrace St
- 7255 Terrace St
- 7310 Terrace St
- 7315 Terrace St
- 7254 Terrace St
- 1408 W 73rd St
- 7318 Terrace St
- 7300 Mercier St
- 7245 Terrace St
- 7310 Mercier St
- 1412 W 73rd St
- 7244 Terrace St
- 1224 W 73rd St
- 7321 Terrace St
- 7241 Terrace St
- 7324 Terrace St
- 1416 W 73rd St
- 1216 W 73rd St
- 7318 Mercier St