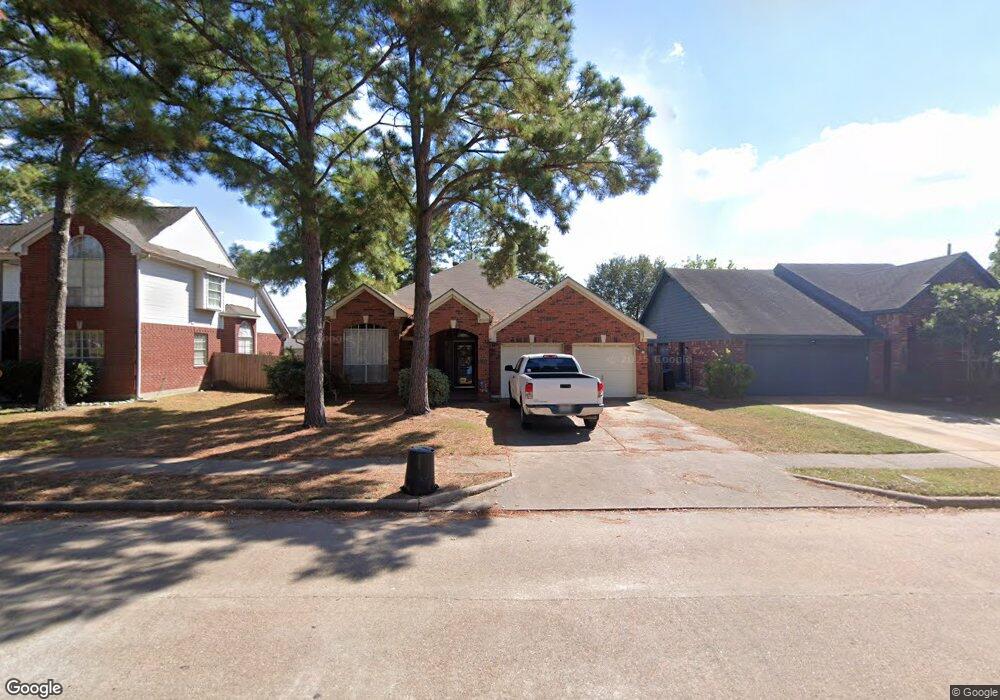
7302 River Garden Dr Houston, TX 77095
Copperfield NeighborhoodEstimated Value: $311,421 - $330,000
4
Beds
2
Baths
2,200
Sq Ft
$146/Sq Ft
Est. Value
About This Home
This home is located at 7302 River Garden Dr, Houston, TX 77095 and is currently estimated at $321,855, approximately $146 per square foot. 7302 River Garden Dr is a home located in Harris County with nearby schools including Lowery Elementary School, Aragon Middle School, and Langham Creek High School.
Ownership History
Date
Name
Owned For
Owner Type
Purchase Details
Closed on
Aug 15, 2005
Sold by
Ferrari John V and Ferrari Paula R
Bought by
Armenta Victor
Current Estimated Value
Home Financials for this Owner
Home Financials are based on the most recent Mortgage that was taken out on this home.
Original Mortgage
$105,000
Outstanding Balance
$64,129
Interest Rate
8.3%
Mortgage Type
Fannie Mae Freddie Mac
Estimated Equity
$257,726
Purchase Details
Closed on
Sep 24, 1999
Sold by
Yoon Henry and Yoon Myong Sin
Bought by
Ferrari John
Home Financials for this Owner
Home Financials are based on the most recent Mortgage that was taken out on this home.
Original Mortgage
$107,350
Interest Rate
8.02%
Purchase Details
Closed on
Dec 20, 1993
Sold by
Dykes L J Joe
Bought by
Yoon Henry and Yoon Myong Sin
Home Financials for this Owner
Home Financials are based on the most recent Mortgage that was taken out on this home.
Original Mortgage
$99,750
Interest Rate
7.19%
Create a Home Valuation Report for This Property
The Home Valuation Report is an in-depth analysis detailing your home's value as well as a comparison with similar homes in the area
Home Values in the Area
Average Home Value in this Area
Purchase History
| Date | Buyer | Sale Price | Title Company |
|---|---|---|---|
| Armenta Victor | -- | Fidelity National Title | |
| Ferrari John | -- | Stewart Title | |
| Yoon Henry | -- | Title Agency |
Source: Public Records
Mortgage History
| Date | Status | Borrower | Loan Amount |
|---|---|---|---|
| Open | Armenta Victor | $105,000 | |
| Previous Owner | Ferrari John | $107,350 | |
| Previous Owner | Yoon Henry | $99,750 |
Source: Public Records
Tax History Compared to Growth
Tax History
| Year | Tax Paid | Tax Assessment Tax Assessment Total Assessment is a certain percentage of the fair market value that is determined by local assessors to be the total taxable value of land and additions on the property. | Land | Improvement |
|---|---|---|---|---|
| 2025 | $3,832 | $310,876 | $64,058 | $246,818 |
| 2024 | $3,832 | $291,590 | $64,058 | $227,532 |
| 2023 | $3,832 | $305,490 | $64,058 | $241,432 |
| 2022 | $5,537 | $284,487 | $45,805 | $238,682 |
| 2021 | $5,306 | $225,112 | $45,805 | $179,307 |
| 2020 | $5,054 | $207,790 | $32,718 | $175,072 |
| 2019 | $5,162 | $205,389 | $25,486 | $179,903 |
| 2018 | $1,827 | $189,819 | $25,486 | $164,333 |
| 2017 | $4,790 | $189,819 | $25,486 | $164,333 |
| 2016 | $4,621 | $183,111 | $25,486 | $157,625 |
| 2015 | $3,182 | $183,111 | $25,486 | $157,625 |
| 2014 | $3,182 | $161,393 | $25,486 | $135,907 |
Source: Public Records
Map
Nearby Homes
- 7318 River Garden Dr
- 15914 Waybridge Glen Ln
- 15726 Echo Lodge Dr
- 7054 River Garden Dr
- 7318 Starbridge Dr
- 7403 Foxton Place Ct
- 7042 River Garden Dr
- 7419 Foxton Place Ct
- 7414 Starbridge Dr
- 7411 Pacific Ridge Ct
- 16023 Gladebrook Glen Ln
- 7411 Marble Glen Ln
- 7415 Broken Ridge Dr
- 15810 Knoll Lake Dr
- 16210 Summer Dew Ln
- 7511 Marble Glen Ln
- 7311 Postwick Ct
- 15818 Smithland Dr
- 16331 Dew Drop Ln
- 15903 Smithland Dr
- 7242 River Garden Dr
- 7306 River Garden Dr
- 7238 River Garden Dr
- 7310 River Garden Dr
- 7234 River Garden Dr
- 15703 Quiet Bay Ct
- 7230 River Garden Dr
- 15707 Quiet Bay Ct
- 15702 Quiet Bay Ct
- 7226 River Garden Dr
- 7222 River Garden Dr
- 15711 Quiet Bay Ct
- 7322 River Garden Dr
- 7214 Palisades Heights Dr
- 15706 Quiet Bay Ct
- 7218 River Garden Dr
- 7326 River Garden Dr
- 7302 Palisades Heights Dr
- 7210 Palisades Heights Dr
- 7214 River Garden Dr