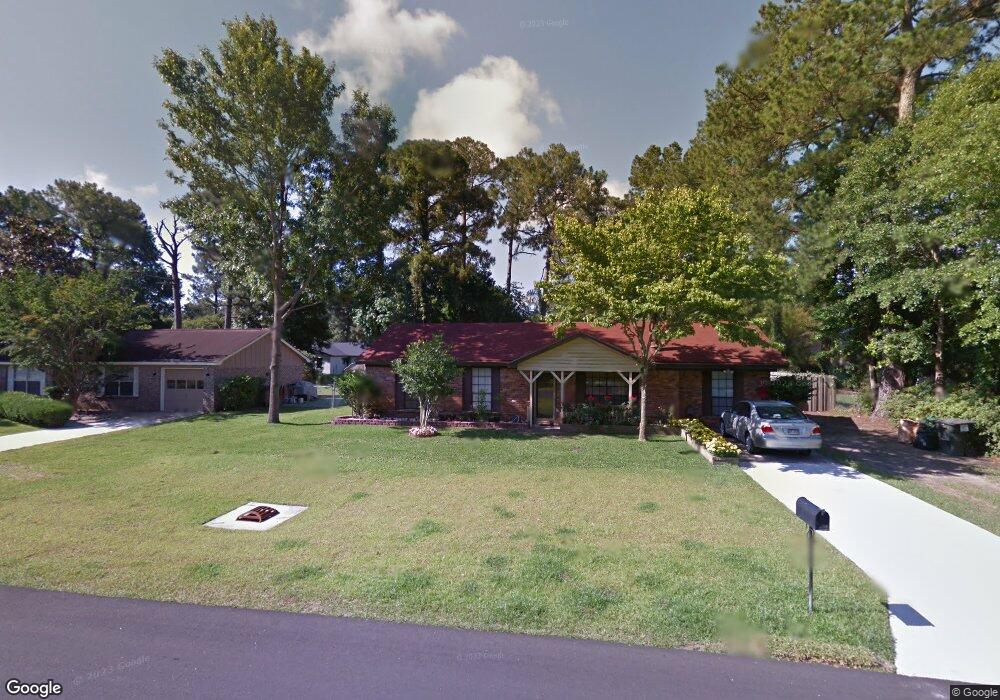
7303 E Sugar Tree Ct Savannah, GA 31410
Estimated Value: $292,000 - $401,000
3
Beds
2
Baths
1,515
Sq Ft
$228/Sq Ft
Est. Value
About This Home
This home is located at 7303 E Sugar Tree Ct, Savannah, GA 31410 and is currently estimated at $346,142, approximately $228 per square foot. 7303 E Sugar Tree Ct is a home located in Chatham County with nearby schools including Marshpoint Elementary School, Coastal Middle School, and Islands High School.
Ownership History
Date
Name
Owned For
Owner Type
Purchase Details
Closed on
May 14, 2015
Sold by
Johnston James Robert
Bought by
Johnston Emily C
Current Estimated Value
Home Financials for this Owner
Home Financials are based on the most recent Mortgage that was taken out on this home.
Original Mortgage
$174,300
Outstanding Balance
$133,259
Interest Rate
3.79%
Mortgage Type
New Conventional
Estimated Equity
$212,883
Purchase Details
Closed on
Apr 17, 2009
Sold by
Mguyen Thu
Bought by
Bui Vu
Home Financials for this Owner
Home Financials are based on the most recent Mortgage that was taken out on this home.
Original Mortgage
$98,500
Interest Rate
5.01%
Mortgage Type
New Conventional
Create a Home Valuation Report for This Property
The Home Valuation Report is an in-depth analysis detailing your home's value as well as a comparison with similar homes in the area
Home Values in the Area
Average Home Value in this Area
Purchase History
| Date | Buyer | Sale Price | Title Company |
|---|---|---|---|
| Johnston Emily C | -- | -- | |
| Johnston James Robert | $183,500 | -- | |
| Bui Vu | -- | -- |
Source: Public Records
Mortgage History
| Date | Status | Borrower | Loan Amount |
|---|---|---|---|
| Open | Johnston James Robert | $174,300 | |
| Closed | Johnston Emily C | $174,300 | |
| Previous Owner | Bui Vu | $98,500 |
Source: Public Records
Tax History
| Year | Tax Paid | Tax Assessment Tax Assessment Total Assessment is a certain percentage of the fair market value that is determined by local assessors to be the total taxable value of land and additions on the property. | Land | Improvement |
|---|---|---|---|---|
| 2025 | $3,036 | $83,680 | $30,000 | $53,680 |
| 2024 | $24 | $76,520 | $30,000 | $46,520 |
| 2023 | $2,433 | $68,880 | $24,000 | $44,880 |
| 2022 | $2,032 | $64,480 | $24,000 | $40,480 |
| 2021 | $2,113 | $57,040 | $24,000 | $33,040 |
| 2020 | $2,124 | $57,520 | $24,000 | $33,520 |
| 2019 | $2,234 | $58,200 | $24,000 | $34,200 |
| 2018 | $2,093 | $54,200 | $24,000 | $30,200 |
| 2017 | $2,806 | $75,960 | $24,000 | $51,960 |
| 2016 | $2,514 | $73,400 | $23,341 | $50,059 |
| 2015 | $1,748 | $76,880 | $24,000 | $52,880 |
| 2014 | -- | $60,400 | $0 | $0 |
Source: Public Records
Map
Nearby Homes
- 7313 Tropical Way
- 7311 Tropical Way
- 11 River Trace Ct
- 103 Shoals Dr Unit K12
- 21 River Trace Ct
- 22 River Walk
- 100 Oyster Shell Rd Unit A-4
- 46 River Oaks Rd
- 2 Ole Oak Rd
- 7010 Johnny Mercer Blvd
- 23 Highpoint Ct
- 17 River Pointe Ct
- 228 Bull River Bluff Dr
- 12 Castaway Place
- 132 Peters Quay
- 106 Bull River Bluff Dr
- 5 Rigger Ct
- 142 Bull River Bluff Dr
- 106 Natalie Ct
- 8001 US Highway 80 E Unit 103
- 7305 E Sugar Tree Ct
- 7301 E Sugar Tree Ct
- 7307 E Sugar Tree Ct
- 7306 E Sugar Tree Ct
- 7304 E Sugar Tree Ct
- 7308 E Sugar Tree Ct
- 7302 E Sugar Tree Ct
- 7309 Tropical Way
- 7213 W Sugar Tree Ct
- 7310 E Sugar Tree Ct
- 7309 E Sugar Tree Ct
- 301 Sugar Tree Ct
- 7312 Tropical Way
- 7310 Tropical Way
- 123 Blue Heron Dr
- 125 Blue Heron Dr
- 7214 W Sugar Tree Ct
- 2714 Sugar Tree Ct
- 7314 Tropical Way
- 7308 Tropical Way
Your Personal Tour Guide
Ask me questions while you tour the home.