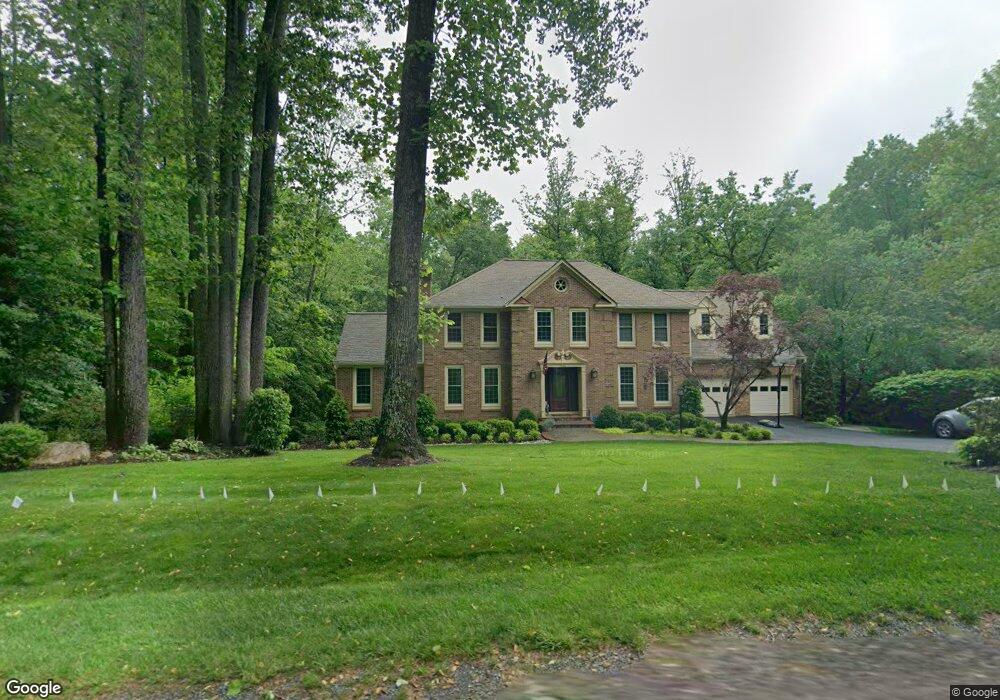
7303 Laketree Dr Fairfax Station, VA 22039
Estimated Value: $1,359,394 - $1,481,000
5
Beds
4
Baths
3,286
Sq Ft
$438/Sq Ft
Est. Value
About This Home
This home is located at 7303 Laketree Dr, Fairfax Station, VA 22039 and is currently estimated at $1,438,349, approximately $437 per square foot. 7303 Laketree Dr is a home located in Fairfax County with nearby schools including Sangster Elementary School, Lake Braddock Secondary School, and Nativity Catholic School.
Ownership History
Date
Name
Owned For
Owner Type
Purchase Details
Closed on
Jul 11, 2025
Sold by
Revocabl Christopher and Revocabl Kristen
Bought by
Benner John Curtis and Stepetic Jennifer L
Current Estimated Value
Home Financials for this Owner
Home Financials are based on the most recent Mortgage that was taken out on this home.
Original Mortgage
$995,000
Outstanding Balance
$993,328
Interest Rate
6.89%
Mortgage Type
New Conventional
Estimated Equity
$445,021
Purchase Details
Closed on
Aug 30, 2023
Sold by
Hewlett Christopher and Hewlett Kristen
Bought by
Christopher And Kristen Hewlett Revocable Tru and Hewlett
Purchase Details
Closed on
May 31, 2016
Sold by
Christopher E Leach Revocable Trust Date
Bought by
Hewlett Christopher and Hewlett Kristen
Home Financials for this Owner
Home Financials are based on the most recent Mortgage that was taken out on this home.
Original Mortgage
$810,000
Interest Rate
3.59%
Mortgage Type
VA
Create a Home Valuation Report for This Property
The Home Valuation Report is an in-depth analysis detailing your home's value as well as a comparison with similar homes in the area
Home Values in the Area
Average Home Value in this Area
Purchase History
| Date | Buyer | Sale Price | Title Company |
|---|---|---|---|
| Benner John Curtis | $1,460,000 | First American Title | |
| Benner John Curtis | $1,460,000 | First American Title | |
| Christopher And Kristen Hewlett Revocable Tru | -- | None Listed On Document | |
| Hewlett Christopher | $900,000 | Bay County Settlements Inc |
Source: Public Records
Mortgage History
| Date | Status | Borrower | Loan Amount |
|---|---|---|---|
| Open | Benner John Curtis | $995,000 | |
| Closed | Benner John Curtis | $995,000 | |
| Previous Owner | Hewlett Christopher | $810,000 |
Source: Public Records
Tax History Compared to Growth
Tax History
| Year | Tax Paid | Tax Assessment Tax Assessment Total Assessment is a certain percentage of the fair market value that is determined by local assessors to be the total taxable value of land and additions on the property. | Land | Improvement |
|---|---|---|---|---|
| 2025 | $13,904 | $1,244,720 | $458,000 | $786,720 |
| 2024 | $13,904 | $1,200,140 | $438,000 | $762,140 |
| 2023 | $12,881 | $1,141,410 | $418,000 | $723,410 |
| 2022 | $10,972 | $959,520 | $333,000 | $626,520 |
| 2021 | $10,674 | $909,570 | $308,000 | $601,570 |
| 2020 | $10,089 | $852,500 | $288,000 | $564,500 |
| 2019 | $10,089 | $852,500 | $288,000 | $564,500 |
| 2018 | $9,676 | $841,350 | $288,000 | $553,350 |
| 2017 | $9,768 | $841,350 | $288,000 | $553,350 |
| 2016 | $4,849 | $807,490 | $283,000 | $524,490 |
| 2015 | $9,012 | $807,490 | $283,000 | $524,490 |
| 2014 | $8,991 | $807,490 | $283,000 | $524,490 |
Source: Public Records
Map
Nearby Homes
- 9849 S Park Cir
- 7104 Park Point Ct
- 9705 Rambling Ridge Ct
- 7706 Woodshade Ct
- 10510 Henderson Rd
- 7209 Reservation Dr
- 7411 Reservation Dr
- 7917 Manor House Dr
- 8197 Cottage Rose Ct
- 9403 Onion Patch Dr
- 10621 Beechnut Ct
- 8024 Eddy Bend Trail
- 9524 Oak Stream Ct
- 9303 Macswain Place
- 9472 Lapstrake Ln
- 9616 Burnt Oak Dr
- 9616 Villagesmith Way
- 6421 Spring Lake Dr
- 9211 Beachway Ln
- 8004 Chippenham Ct
- 7305 Laketree Dr
- 7301 Laketree Dr
- 7307 Laketree Dr
- 7320 South View Ct
- 7217 Laketree Dr
- 7321 S View Ct
- 7321 South View Ct
- 7309 Laketree Dr
- 7318 South View Ct
- 7318 S View Ct
- 7311 Laketree Dr
- 7215 Laketree Dr
- 7319 South View Ct
- 7316 South View Ct
- 7317 South View Ct
- 7313 Laketree Dr
- 7213 Laketree Dr
- 7416 S Reach Dr
- 7416 South Reach Dr
- 7314 South View Ct