Estimated Value: $208,000 - $227,000
3
Beds
1
Bath
1,220
Sq Ft
$176/Sq Ft
Est. Value
About This Home
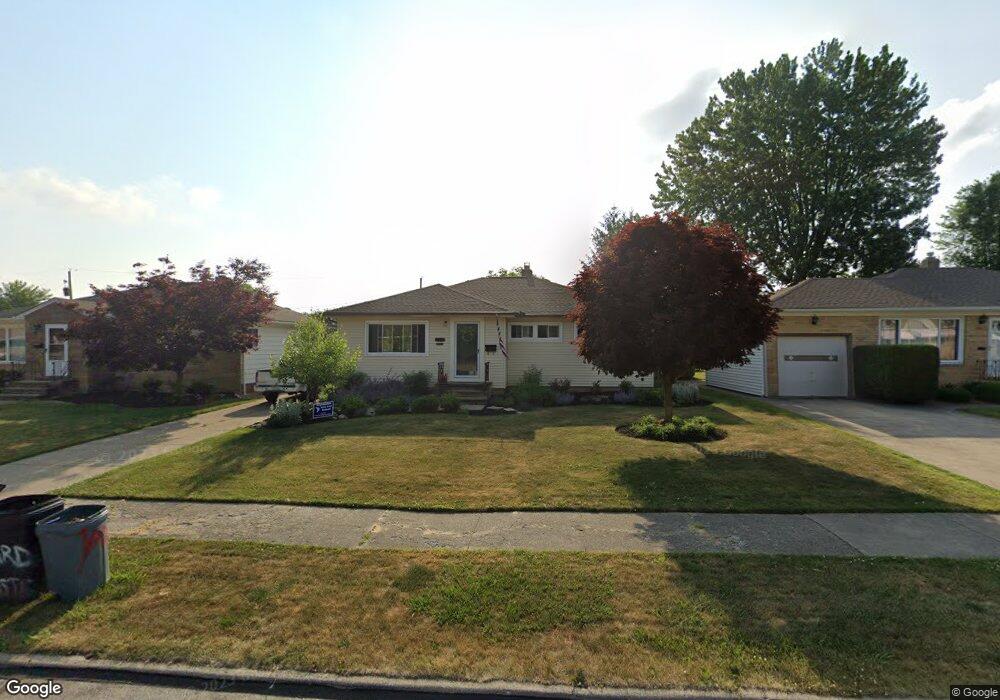
This home is located at 7305 Maplewood Rd, Parma, OH 44130 and is currently estimated at $214,881, approximately $176 per square foot. 7305 Maplewood Rd is a home located in Cuyahoga County with nearby schools including Pleasant Valley Elementary School, Greenbriar Middle School, and Valley Forge High School.
Ownership History
Date
Name
Owned For
Owner Type
Purchase Details
Closed on
Dec 29, 1997
Sold by
Osowski Denis M
Bought by
Boreczky Monica L and Semon Raymond J
Current Estimated Value
Home Financials for this Owner
Home Financials are based on the most recent Mortgage that was taken out on this home.
Original Mortgage
$109,000
Outstanding Balance
$19,269
Interest Rate
7.35%
Mortgage Type
New Conventional
Estimated Equity
$195,612
Purchase Details
Closed on
Sep 15, 1993
Sold by
Osowski Denis M
Bought by
Osowski Denis M
Purchase Details
Closed on
Dec 10, 1992
Sold by
Ferraro James J
Bought by
Osowski Denis M
Purchase Details
Closed on
Aug 16, 1988
Sold by
Mcilveen Dennis E
Bought by
Ferraro James J
Purchase Details
Closed on
Dec 12, 1986
Sold by
Mcilveen Dennis E
Bought by
Mcilveen Dennis E
Purchase Details
Closed on
Sep 18, 1978
Sold by
Demko Mary
Bought by
Mcilveen Dennis E
Purchase Details
Closed on
Jan 1, 1975
Bought by
Demko Mary
Create a Home Valuation Report for This Property
The Home Valuation Report is an in-depth analysis detailing your home's value as well as a comparison with similar homes in the area
Home Values in the Area
Average Home Value in this Area
Purchase History
| Date | Buyer | Sale Price | Title Company |
|---|---|---|---|
| Boreczky Monica L | $114,900 | -- | |
| Osowski Denis M | -- | -- | |
| Osowski Denis M | $98,000 | -- | |
| Ferraro James J | $79,500 | -- | |
| Mcilveen Dennis E | -- | -- | |
| Mcilveen Dennis E | $57,000 | -- | |
| Demko Mary | -- | -- |
Source: Public Records
Mortgage History
| Date | Status | Borrower | Loan Amount |
|---|---|---|---|
| Open | Boreczky Monica L | $109,000 |
Source: Public Records
Tax History
| Year | Tax Paid | Tax Assessment Tax Assessment Total Assessment is a certain percentage of the fair market value that is determined by local assessors to be the total taxable value of land and additions on the property. | Land | Improvement |
|---|---|---|---|---|
| 2024 | $3,983 | $63,630 | $12,460 | $51,170 |
| 2023 | $3,653 | $50,410 | $10,120 | $40,290 |
| 2022 | $3,621 | $50,400 | $10,120 | $40,290 |
| 2021 | $3,729 | $50,400 | $10,120 | $40,290 |
| 2020 | $3,535 | $42,350 | $8,510 | $33,850 |
| 2019 | $3,398 | $121,000 | $24,300 | $96,700 |
| 2018 | $3,319 | $42,350 | $8,510 | $33,850 |
| 2017 | $3,389 | $39,270 | $7,000 | $32,270 |
| 2016 | $3,367 | $39,270 | $7,000 | $32,270 |
| 2015 | $3,208 | $39,270 | $7,000 | $32,270 |
| 2014 | $3,208 | $39,270 | $7,000 | $32,270 |
Source: Public Records
Map
Nearby Homes
- 7209 Maplewood Rd
- 7265 Parma Park Blvd
- 7042 Parma Park Blvd
- 7547 N Linden Ln
- 7706 E Linden Ln
- 6954 Orchard Blvd
- 6883 Orchard Blvd
- 6775 Oakwood Rd
- 6845 Commonwealth Blvd
- 6751 Oakwood Rd
- 7683 Princeton Place
- 11770 Barrington Blvd
- 14750 Seneca Trail
- 6919 N Parkway Dr
- 6693 Parma Park Blvd
- 6640 Pearl Rd Unit 402
- 12387 W Sprague Rd
- 11607 Stormes Dr
- 11183 Johnson Dr
- 7181 York Rd
- 7311 Maplewood Rd
- 7299 Maplewood Rd
- 7317 Maplewood Rd
- 7293 Maplewood Rd
- 7304 Oakwood Rd
- 7310 Oakwood Rd
- 7296 Oakwood Rd
- 7290 Oakwood Rd
- 7323 Maplewood Rd
- 7306 Maplewood Rd
- 7312 Maplewood Rd
- 7287 Maplewood Rd
- 7300 Maplewood Rd
- 7294 Maplewood Rd
- 7318 Maplewood Rd
- 7320 Oakwood Rd
- 7284 Oakwood Rd
- 7329 Maplewood Rd
- 7281 Maplewood Rd
- 7288 Maplewood Rd
Your Personal Tour Guide
Ask me questions while you tour the home.