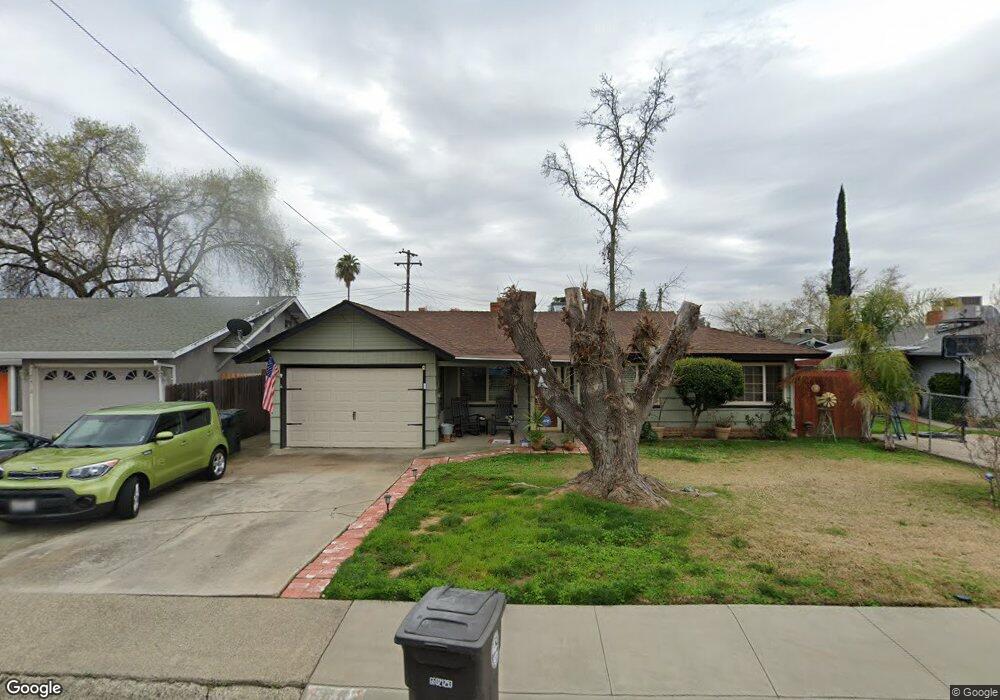
7306 Little Oaks Way Citrus Heights, CA 95621
Estimated Value: $354,000 - $413,000
3
Beds
1
Bath
1,045
Sq Ft
$364/Sq Ft
Est. Value
About This Home
This home is located at 7306 Little Oaks Way, Citrus Heights, CA 95621 and is currently estimated at $380,456, approximately $364 per square foot. 7306 Little Oaks Way is a home located in Sacramento County with nearby schools including Grand Oaks Elementary School, Sylvan Middle School, and Mesa Verde High School.
Ownership History
Date
Name
Owned For
Owner Type
Purchase Details
Closed on
Aug 27, 2018
Sold by
Railsback Steven and Railsback Judy A
Bought by
Railsback Steven Charles and Railsback Judith Aline
Current Estimated Value
Purchase Details
Closed on
Mar 26, 2003
Sold by
Railsback Judy A
Bought by
Railsback Steven and Railsback Judy A
Home Financials for this Owner
Home Financials are based on the most recent Mortgage that was taken out on this home.
Original Mortgage
$85,000
Interest Rate
5.83%
Purchase Details
Closed on
Mar 10, 2003
Sold by
Railsback Steven
Bought by
Railsback Judy A
Home Financials for this Owner
Home Financials are based on the most recent Mortgage that was taken out on this home.
Original Mortgage
$85,000
Interest Rate
5.83%
Purchase Details
Closed on
Dec 26, 2002
Sold by
Davis Charles Wendell
Bought by
Railsback Judy A
Purchase Details
Closed on
Sep 11, 1998
Sold by
Davis Charles W
Bought by
Davis Charles Wendell
Create a Home Valuation Report for This Property
The Home Valuation Report is an in-depth analysis detailing your home's value as well as a comparison with similar homes in the area
Home Values in the Area
Average Home Value in this Area
Purchase History
| Date | Buyer | Sale Price | Title Company |
|---|---|---|---|
| Railsback Steven Charles | -- | None Available | |
| Railsback Steven | -- | -- | |
| Railsback Judy A | -- | Financial Title Company | |
| Railsback Judy A | -- | -- | |
| Davis Charles Wendell | -- | First American Title Ins Co |
Source: Public Records
Mortgage History
| Date | Status | Borrower | Loan Amount |
|---|---|---|---|
| Closed | Railsback Judy A | $85,000 |
Source: Public Records
Tax History Compared to Growth
Tax History
| Year | Tax Paid | Tax Assessment Tax Assessment Total Assessment is a certain percentage of the fair market value that is determined by local assessors to be the total taxable value of land and additions on the property. | Land | Improvement |
|---|---|---|---|---|
| 2025 | $1,443 | $127,469 | $36,892 | $90,577 |
| 2024 | $1,443 | $124,970 | $36,169 | $88,801 |
| 2023 | $1,405 | $122,520 | $35,460 | $87,060 |
| 2022 | $1,396 | $120,118 | $34,765 | $85,353 |
| 2021 | $1,372 | $117,764 | $34,084 | $83,680 |
| 2020 | $1,346 | $116,557 | $33,735 | $82,822 |
| 2019 | $1,317 | $114,273 | $33,074 | $81,199 |
| 2018 | $1,301 | $112,033 | $32,426 | $79,607 |
| 2017 | $1,287 | $109,838 | $31,791 | $78,047 |
| 2016 | $1,202 | $107,685 | $31,168 | $76,517 |
| 2015 | $1,180 | $106,068 | $30,700 | $75,368 |
| 2014 | $1,155 | $103,991 | $30,099 | $73,892 |
Source: Public Records
Map
Nearby Homes
- 8016 Lesser Way
- 206 Pau Hana Cir
- 266 Corto Ln Unit 266
- 187 Saxton Cir
- 256 Corto Ln
- 7128 Parish Way
- 230 Pau Hanna Cir Unit 230
- 54 Saxton Cir
- 243 Pau Hana Cir
- 7448 Grand Oaks Blvd
- 7783 Live Oak Way
- 8001 Lichen Dr
- 8206 Lichen Dr
- 165 Hanover St
- 137 Duval St
- 6633 Briartree Way
- 7401 Auburn Oaks Ct Unit E
- 7401 Auburn Oaks Ct Unit M
- 8431 White Plains Ct
- 8424 Lost Cavern Ct
- 7312 Little Oaks Way
- 8028 Rosswood Dr
- 8024 Rosswood Dr
- 7318 Little Oaks Way
- 8031 Red Oaks Ct
- 7311 Little Oaks Way
- 7305 Little Oaks Way
- 8020 Rosswood Dr
- 7317 Little Oaks Way
- 8020 Red Oaks Ct
- 8032 Rosswood Dr
- 7324 Little Oaks Way
- 8021 Red Oaks Ct
- 7325 Little Oaks Way
- 8027 Rosswood Dr
- 8016 Rosswood Dr
- 8031 Rosswood Dr
- 8023 Rosswood Dr
- 8010 Red Oaks Ct
- 7320 Oakberry Way