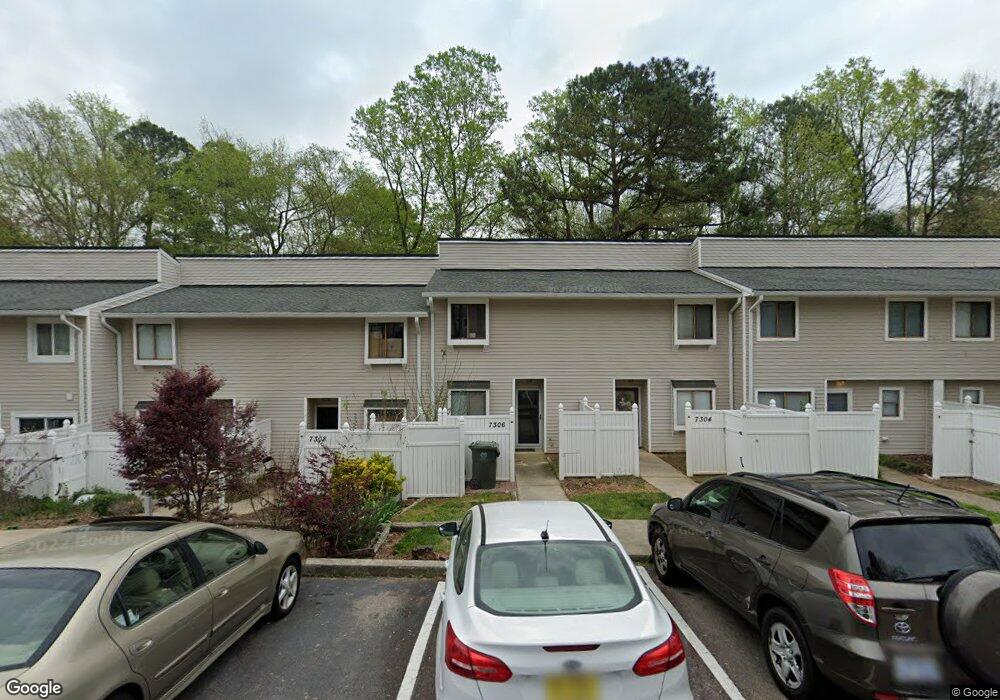
7306 Sandy Creek Dr Unit P4 Raleigh, NC 27615
Six Forks NeighborhoodEstimated Value: $198,000 - $230,000
2
Beds
2
Baths
1,147
Sq Ft
$188/Sq Ft
Est. Value
About This Home
This home is located at 7306 Sandy Creek Dr Unit P4, Raleigh, NC 27615 and is currently estimated at $215,477, approximately $187 per square foot. 7306 Sandy Creek Dr Unit P4 is a home located in Wake County with nearby schools including Pleasant Union Elementary School, West Millbrook Middle School, and Sanderson High School.
Ownership History
Date
Name
Owned For
Owner Type
Purchase Details
Closed on
Sep 30, 2009
Sold by
Nasholds Kurt M and Nasholds Tracy D
Bought by
Lindsay Kristen Nichole
Current Estimated Value
Home Financials for this Owner
Home Financials are based on the most recent Mortgage that was taken out on this home.
Original Mortgage
$93,279
Outstanding Balance
$61,003
Interest Rate
5.11%
Mortgage Type
FHA
Estimated Equity
$154,474
Purchase Details
Closed on
May 31, 2000
Sold by
Glace Jason B and Murphy Felicia A
Bought by
Nasholds Kurt M
Home Financials for this Owner
Home Financials are based on the most recent Mortgage that was taken out on this home.
Original Mortgage
$87,500
Interest Rate
8.75%
Purchase Details
Closed on
Apr 23, 1998
Sold by
Villareal Starlene J
Bought by
Glace Jason B and Murphy Felicia A
Home Financials for this Owner
Home Financials are based on the most recent Mortgage that was taken out on this home.
Original Mortgage
$73,200
Interest Rate
7.09%
Create a Home Valuation Report for This Property
The Home Valuation Report is an in-depth analysis detailing your home's value as well as a comparison with similar homes in the area
Home Values in the Area
Average Home Value in this Area
Purchase History
| Date | Buyer | Sale Price | Title Company |
|---|---|---|---|
| Lindsay Kristen Nichole | $95,000 | None Available | |
| Nasholds Kurt M | $86,500 | -- | |
| Glace Jason B | $75,500 | -- |
Source: Public Records
Mortgage History
| Date | Status | Borrower | Loan Amount |
|---|---|---|---|
| Open | Lindsay Kristen Nichole | $93,279 | |
| Previous Owner | Nasholds Kurt M | $87,500 | |
| Previous Owner | Glace Jason B | $73,200 |
Source: Public Records
Tax History Compared to Growth
Tax History
| Year | Tax Paid | Tax Assessment Tax Assessment Total Assessment is a certain percentage of the fair market value that is determined by local assessors to be the total taxable value of land and additions on the property. | Land | Improvement |
|---|---|---|---|---|
| 2025 | $1,981 | $224,877 | -- | $224,877 |
| 2024 | $1,973 | $224,877 | $0 | $224,877 |
| 2023 | $1,597 | $128,047 | $0 | $128,047 |
| 2022 | $1,485 | $128,047 | $0 | $128,047 |
| 2021 | $1,266 | $128,047 | $0 | $128,047 |
| 2020 | $1,320 | $128,047 | $0 | $128,047 |
| 2019 | $1,115 | $88,919 | $0 | $88,919 |
| 2018 | $1,052 | $88,919 | $0 | $88,919 |
| 2017 | $1,003 | $88,919 | $0 | $88,919 |
| 2016 | $926 | $88,919 | $0 | $88,919 |
| 2015 | $949 | $89,741 | $0 | $89,741 |
| 2014 | -- | $89,741 | $0 | $89,741 |
Source: Public Records
Map
Nearby Homes
- 7320 Sandy Creek Dr
- 7719 Kelley Ct Unit 314E
- 7729 Bernadette Ln Unit 322B
- 232 Wetherburn Ln
- 204 Bracken Ct
- 213 Bracken Ct
- 7412 Penny Hill Ln
- 800 Plentywood Ct
- 812 Havenwood Ct
- 7715 Kingsberry Ct
- 7731 Kingsberry Ct
- 7329 Bonnie Ridge Ct
- 7046 Longstreet Dr Unit C
- 119 Yorkchester Way
- 7020 Longstreet Dr Unit A
- 7124 Longstreet Dr
- 7002 Longstreet Dr Unit C
- 7108 Longstreet Dr Unit A
- 136 Yorkchester Way
- 8009 Running Cedar Trail
- 7310 Sandy Creek Dr Unit P6
- 7308 Sandy Creek Dr
- 7308 Sandy Creek Dr Unit 5
- 7312 Sandy Creek Dr Unit P7
- 7312 Sandy Creek Dr Unit 7
- 7314 Sandy Creek Dr
- 7314 Sandy Creek Dr Unit P8
- 7314 Sandy Creek Dr Unit 1
- 7304 Sandy Creek Dr
- 7304 Sandy Creek Dr Unit 1
- 7302 Sandy Creek Dr Unit P2
- 7302 Sandy Creek Dr
- 7300 Sandy Creek Dr Unit 1
- 7318 Sandy Creek Dr Unit Q1
- 7318 Sandy Creek Dr Unit 1
- 7231 Sandy Creek Dr Unit N7
- 7322 Sandy Creek Dr Unit Q3
- 7233 Sandy Creek Dr
- 7324 Sandy Creek Dr Unit Q4
- 7324 Sandy Creek Dr Unit 7324