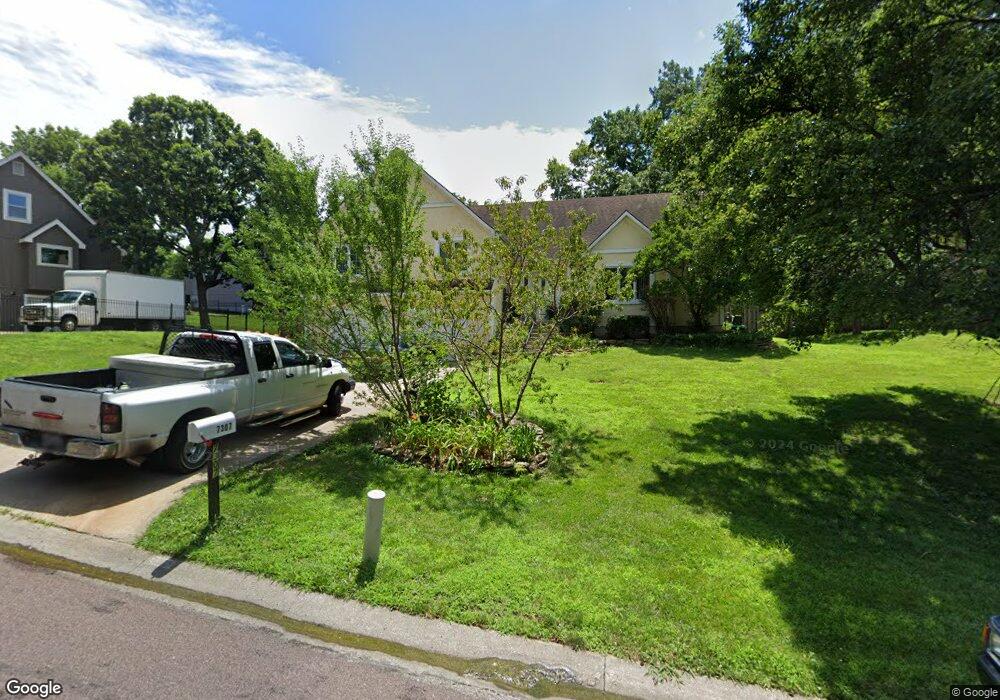
7307 W 57th St Mission, KS 66202
Estimated Value: $403,000 - $449,000
3
Beds
3
Baths
2,397
Sq Ft
$178/Sq Ft
Est. Value
About This Home
This home is located at 7307 W 57th St, Mission, KS 66202 and is currently estimated at $427,803, approximately $178 per square foot. 7307 W 57th St is a home located in Johnson County with nearby schools including Crestview Elementary School, Hocker Grove Middle School, and Shawnee Mission North High School.
Ownership History
Date
Name
Owned For
Owner Type
Purchase Details
Closed on
Jun 27, 2018
Sold by
Russo Beverly and Russo Theresa M
Bought by
Russo Schroeder Theresa M and Schroeder Bruce W
Current Estimated Value
Home Financials for this Owner
Home Financials are based on the most recent Mortgage that was taken out on this home.
Original Mortgage
$146,500
Outstanding Balance
$127,245
Interest Rate
4.6%
Mortgage Type
New Conventional
Estimated Equity
$300,558
Purchase Details
Closed on
Mar 29, 2013
Sold by
Russo Beverly
Bought by
Russo Beverly and Russo Theresa M
Purchase Details
Closed on
Jun 26, 2009
Sold by
Ferguson Wade C and Ferguson Annamarie
Bought by
Russo Beverly
Home Financials for this Owner
Home Financials are based on the most recent Mortgage that was taken out on this home.
Original Mortgage
$164,957
Interest Rate
4.97%
Mortgage Type
FHA
Create a Home Valuation Report for This Property
The Home Valuation Report is an in-depth analysis detailing your home's value as well as a comparison with similar homes in the area
Home Values in the Area
Average Home Value in this Area
Purchase History
| Date | Buyer | Sale Price | Title Company |
|---|---|---|---|
| Russo Schroeder Theresa M | -- | Broker S Title Llc | |
| Russo Beverly | -- | None Available | |
| Russo Beverly | -- | Affinity Title Company |
Source: Public Records
Mortgage History
| Date | Status | Borrower | Loan Amount |
|---|---|---|---|
| Open | Russo Schroeder Theresa M | $146,500 | |
| Previous Owner | Russo Beverly | $164,957 |
Source: Public Records
Tax History Compared to Growth
Tax History
| Year | Tax Paid | Tax Assessment Tax Assessment Total Assessment is a certain percentage of the fair market value that is determined by local assessors to be the total taxable value of land and additions on the property. | Land | Improvement |
|---|---|---|---|---|
| 2024 | $3,739 | $38,847 | $9,601 | $29,246 |
| 2023 | $3,990 | $40,745 | $7,671 | $33,074 |
| 2022 | $3,606 | $37,111 | $7,671 | $29,440 |
| 2021 | $3,606 | $32,430 | $6,970 | $25,460 |
| 2020 | $3,082 | $30,222 | $6,330 | $23,892 |
| 2019 | $3,047 | $29,900 | $3,932 | $25,968 |
| 2018 | $3,338 | $36,398 | $3,932 | $32,466 |
| 2017 | $3,337 | $32,062 | $3,419 | $28,643 |
| 2016 | $3,218 | $30,418 | $3,419 | $26,999 |
| 2015 | $2,948 | $28,428 | $3,419 | $25,009 |
| 2013 | -- | $25,772 | $3,419 | $22,353 |
Source: Public Records
Map
Nearby Homes
- 5729 Metcalf Ct
- 5737 Metcalf Ct Unit 25
- 7407 W 56th Terrace
- 5702 Metcalf Ct
- 5840 Floyd St
- 7618 W 59th Terrace Unit 310
- 5537 Lowell St
- 7201 W 54th St
- 7715 W 54th Terrace
- 6620 W 56th St
- 5504 Glenwood St
- 5701 Russell St
- 7623 W 52nd St
- 6019 Hemlock St
- 5801 Woodward St
- 6130 Riggs Rd
- 6615 Florence St
- 6611 Florence St
- 6610 Florence St
- 6614 Florence St