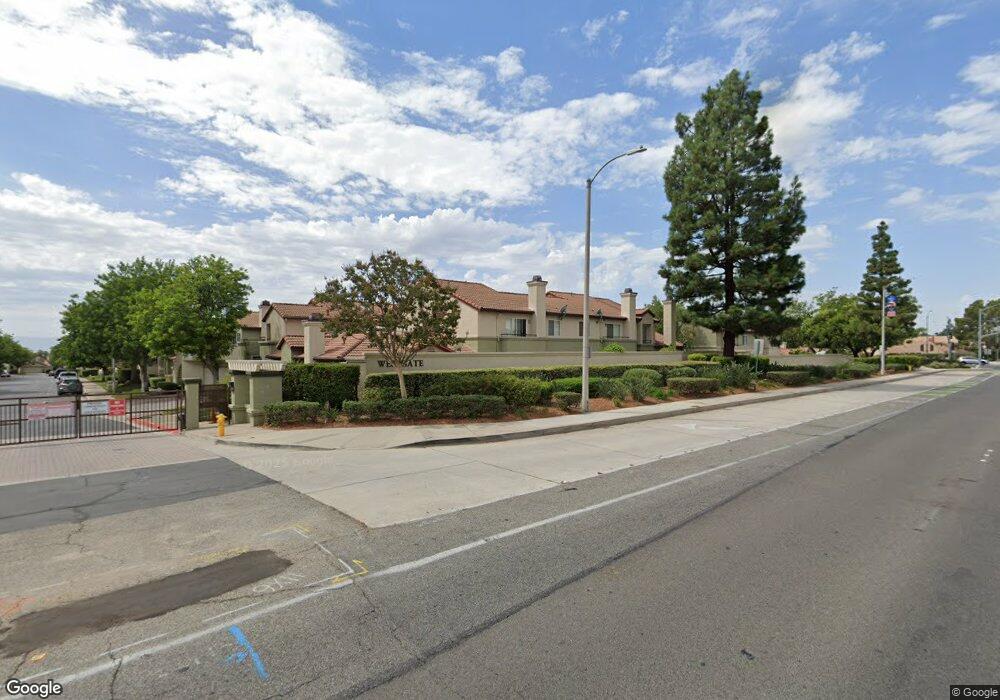
7308 Greenhaven Ave Unit 4 Rancho Cucamonga, CA 91730
Terra Vista NeighborhoodEstimated Value: $549,073 - $595,000
3
Beds
3
Baths
1,390
Sq Ft
$418/Sq Ft
Est. Value
About This Home
This home is located at 7308 Greenhaven Ave Unit 4, Rancho Cucamonga, CA 91730 and is currently estimated at $581,018, approximately $417 per square foot. 7308 Greenhaven Ave Unit 4 is a home located in San Bernardino County with nearby schools including Dona Merced Elementary, Ruth Musser Middle, and Rancho Cucamonga High School.
Ownership History
Date
Name
Owned For
Owner Type
Purchase Details
Closed on
Oct 26, 2020
Sold by
Liu Jen Chung and Chan Rung Chuan
Bought by
Liu Jen Chung and Chan Rung Chuan
Current Estimated Value
Home Financials for this Owner
Home Financials are based on the most recent Mortgage that was taken out on this home.
Original Mortgage
$231,900
Outstanding Balance
$167,503
Interest Rate
2.8%
Mortgage Type
New Conventional
Estimated Equity
$413,515
Purchase Details
Closed on
Jun 10, 2009
Sold by
Campbell Kathy A
Bought by
Liu Jen Chung and Chan Rung Chuan
Home Financials for this Owner
Home Financials are based on the most recent Mortgage that was taken out on this home.
Original Mortgage
$240,562
Interest Rate
5.3%
Mortgage Type
FHA
Purchase Details
Closed on
Mar 11, 1998
Sold by
Vandergoes Mike and Vandergoes Christina M
Bought by
Campbell Kathy A
Home Financials for this Owner
Home Financials are based on the most recent Mortgage that was taken out on this home.
Original Mortgage
$118,840
Interest Rate
7.06%
Mortgage Type
FHA
Create a Home Valuation Report for This Property
The Home Valuation Report is an in-depth analysis detailing your home's value as well as a comparison with similar homes in the area
Home Values in the Area
Average Home Value in this Area
Purchase History
| Date | Buyer | Sale Price | Title Company |
|---|---|---|---|
| Liu Jen Chung | -- | Orange Coast Title Company | |
| Liu Jen Chung | $245,000 | Stewart Title Company | |
| Campbell Kathy A | $122,000 | First American Title Ins Co | |
| Vendergoes Mike | -- | First American Title Ins Co |
Source: Public Records
Mortgage History
| Date | Status | Borrower | Loan Amount |
|---|---|---|---|
| Open | Liu Jen Chung | $231,900 | |
| Previous Owner | Liu Jen Chung | $240,562 | |
| Previous Owner | Campbell Kathy A | $118,840 |
Source: Public Records
Tax History Compared to Growth
Tax History
| Year | Tax Paid | Tax Assessment Tax Assessment Total Assessment is a certain percentage of the fair market value that is determined by local assessors to be the total taxable value of land and additions on the property. | Land | Improvement |
|---|---|---|---|---|
| 2025 | $3,965 | $316,254 | $79,063 | $237,191 |
| 2024 | $3,965 | $310,053 | $77,513 | $232,540 |
| 2023 | $3,863 | $303,973 | $75,993 | $227,980 |
| 2022 | $3,783 | $298,013 | $74,503 | $223,510 |
| 2021 | $3,783 | $292,169 | $73,042 | $219,127 |
| 2020 | $3,689 | $289,173 | $72,293 | $216,880 |
| 2019 | $3,673 | $283,502 | $70,875 | $212,627 |
| 2018 | $3,584 | $277,943 | $69,485 | $208,458 |
| 2017 | $3,528 | $272,494 | $68,123 | $204,371 |
| 2016 | $3,509 | $267,151 | $66,787 | $200,364 |
| 2015 | $3,469 | $263,138 | $65,784 | $197,354 |
| 2014 | $3,377 | $257,983 | $64,495 | $193,488 |
Source: Public Records
Map
Nearby Homes
- 7314 Greenhaven Ave Unit 74
- 10627 Wildrose Dr
- 10669 Wildrose Dr
- 7355 Ambrosia Rd
- 7208 Marine Ave
- 7175 Summerfield Place
- 10350 Base Line Rd
- 10350 Base Line Rd Unit 192
- 10350 Baseline Rd Unit 173
- 10487 Balsa St
- 7224 Parkside Place
- 10650 Grandview Dr
- 7055 Mango St
- 10781 La Vine St
- 7688 Gainey Ct
- 7718 Haywood Place
- 10210 Baseline Rd Unit 62
- 10210 Baseline Rd Unit 115
- 10210 Baseline Rd Unit 289
- 6959 Center Ave
- 7308 Greenhaven Ave
- 7308 Greenhaven Ave Unit 1
- 7308 Greenhaven Ave Unit 6
- 7308 Greenhaven Ave Unit 5
- 7308 Greenhaven Ave Unit 3
- 7308 Greenhaven Ave Unit 2
- 7308 Greenhaven Ave Unit 1
- 7314 Greenhaven Ave
- 7314 Greenhaven Ave Unit 76
- 7314 Greenhaven Ave Unit 75
- 7314 Greenhaven Ave Unit 73
- 7320 Greenhaven Ave Unit 11
- 7320 Greenhaven Ave Unit 12
- 7320 Greenhaven Ave Unit 10
- 7320 Greenhaven Ave Unit 9
- 7320 Greenhaven Ave Unit 8
- 7320 Greenhaven Ave Unit 7
- 7332 Greenhaven Ave Unit 14
- 7332 Greenhaven Ave Unit 17
- 7332 Greenhaven Ave Unit 13