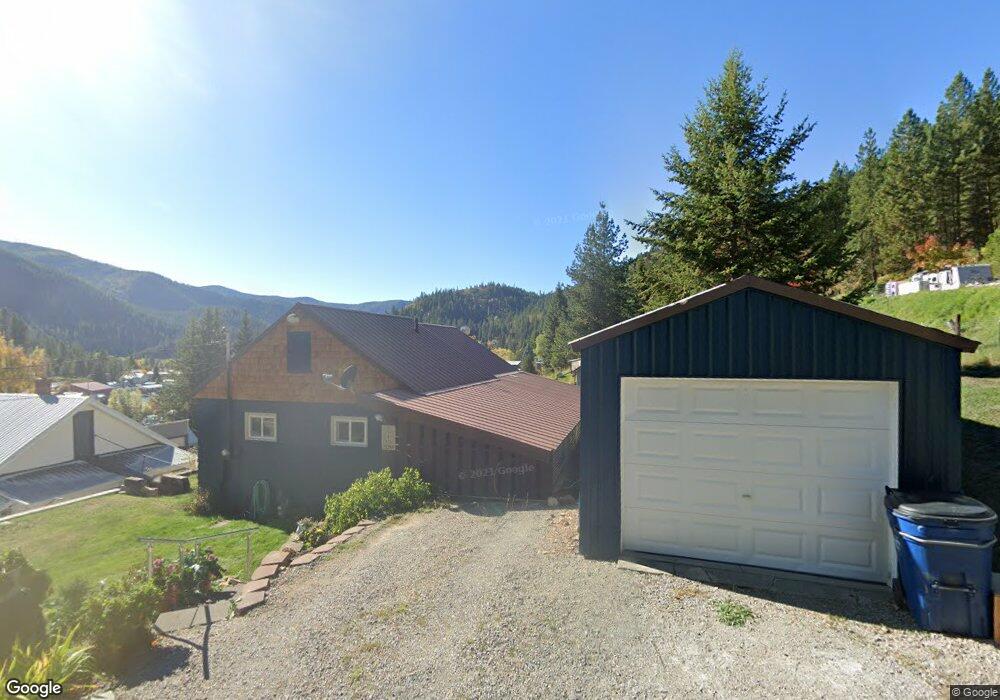
731 1/2 Pine St Mullan, ID 83846
Estimated Value: $176,368 - $226,000
2
Beds
1
Bath
770
Sq Ft
$264/Sq Ft
Est. Value
About This Home
This home is located at 731 1/2 Pine St, Mullan, ID 83846 and is currently estimated at $203,592, approximately $264 per square foot. 731 1/2 Pine St is a home located in Shoshone County with nearby schools including John Mullan Elementary School and Mullan School District.
Ownership History
Date
Name
Owned For
Owner Type
Purchase Details
Closed on
Jul 23, 2024
Sold by
Page Judith H and Hebert Judith E
Bought by
Angle Destiny
Current Estimated Value
Home Financials for this Owner
Home Financials are based on the most recent Mortgage that was taken out on this home.
Original Mortgage
$224,730
Outstanding Balance
$221,931
Interest Rate
6.77%
Mortgage Type
VA
Estimated Equity
-$18,339
Purchase Details
Closed on
Jul 12, 2016
Sold by
Erickson Daniel J and Erickson Cheryl M
Bought by
Hebert Judith E
Create a Home Valuation Report for This Property
The Home Valuation Report is an in-depth analysis detailing your home's value as well as a comparison with similar homes in the area
Home Values in the Area
Average Home Value in this Area
Purchase History
| Date | Buyer | Sale Price | Title Company |
|---|---|---|---|
| Angle Destiny | -- | Flying S Title And Escrow | |
| Hebert Judith E | -- | First American Title Co |
Source: Public Records
Mortgage History
| Date | Status | Borrower | Loan Amount |
|---|---|---|---|
| Open | Angle Destiny | $224,730 |
Source: Public Records
Tax History
| Year | Tax Paid | Tax Assessment Tax Assessment Total Assessment is a certain percentage of the fair market value that is determined by local assessors to be the total taxable value of land and additions on the property. | Land | Improvement |
|---|---|---|---|---|
| 2025 | $705 | $140,686 | $34,142 | $106,544 |
| 2024 | -- | $140,686 | $34,142 | $106,544 |
| 2023 | $1,375 | $126,101 | $37,166 | $88,935 |
| 2022 | $717 | $114,227 | $29,307 | $84,920 |
| 2021 | $766 | $75,029 | $14,029 | $61,000 |
| 2020 | $673 | $64,027 | $12,747 | $51,280 |
| 2019 | $592 | $53,864 | $11,594 | $42,270 |
| 2018 | $467 | $36,420 | $10,540 | $25,880 |
| 2017 | $450 | $34,250 | $10,540 | $23,710 |
| 2016 | $867 | $33,590 | $10,540 | $23,050 |
| 2015 | -- | $33,340 | $10,540 | $22,800 |
| 2014 | -- | $33,340 | $10,540 | $22,800 |
Source: Public Records
Map
Nearby Homes
Your Personal Tour Guide
Ask me questions while you tour the home.