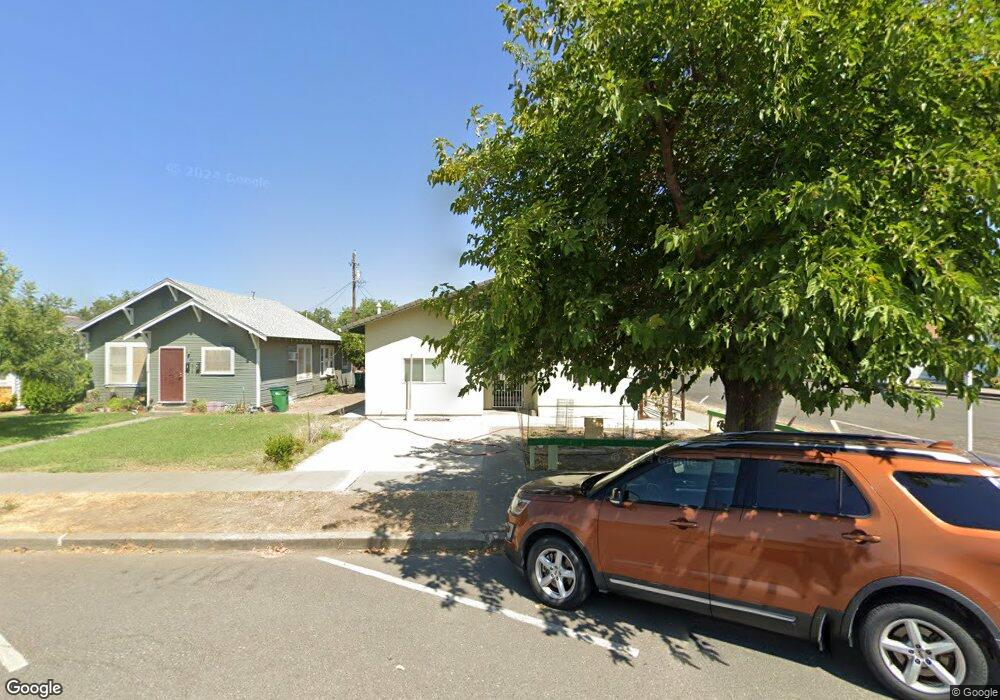
731 A St Orland, CA 95963
Estimated Value: $380,000 - $389,000
--
Bed
4
Baths
1,696
Sq Ft
$226/Sq Ft
Est. Value
About This Home
This home is located at 731 A St, Orland, CA 95963 and is currently estimated at $383,192, approximately $225 per square foot. 731 A St is a home with nearby schools including Mill Street Elementary School, Fairview Elementary School, and Price Intermediate School.
Ownership History
Date
Name
Owned For
Owner Type
Purchase Details
Closed on
Jan 10, 2023
Sold by
Santana Adrian
Bought by
Adrian Santana Revocable Living Trust
Current Estimated Value
Purchase Details
Closed on
Dec 29, 2022
Sold by
Mantes Herminia Santana
Bought by
Santana Adrian
Purchase Details
Closed on
Jan 29, 2013
Sold by
Santana Adrian
Bought by
Montes Herminia Santana
Purchase Details
Closed on
Nov 13, 2012
Sold by
Sutton Patrick L and Sutton Lorraine B
Bought by
Santana Adrian
Purchase Details
Closed on
Oct 12, 2010
Sold by
Sutton Patrick L and Sutton Lorraine B
Bought by
Sutton Patrick L and Sutton Lorraine B
Create a Home Valuation Report for This Property
The Home Valuation Report is an in-depth analysis detailing your home's value as well as a comparison with similar homes in the area
Purchase History
| Date | Buyer | Sale Price | Title Company |
|---|---|---|---|
| Adrian Santana Revocable Living Trust | -- | -- | |
| Santana Adrian | -- | -- | |
| Montes Herminia Santana | -- | North State Title Company | |
| Santana Adrian | $22,000 | North State Title Company | |
| Sutton Patrick L | -- | None Available |
Source: Public Records
Tax History
| Year | Tax Paid | Tax Assessment Tax Assessment Total Assessment is a certain percentage of the fair market value that is determined by local assessors to be the total taxable value of land and additions on the property. | Land | Improvement |
|---|---|---|---|---|
| 2025 | $3,961 | $364,140 | $52,020 | $312,120 |
| 2024 | $3,961 | $357,000 | $51,000 | $306,000 |
| 2023 | $1,697 | $150,706 | $25,916 | $124,790 |
| 2022 | $1,667 | $147,752 | $25,408 | $122,344 |
| 2021 | $1,658 | $144,856 | $24,910 | $119,946 |
| 2020 | $1,658 | $143,372 | $24,655 | $118,717 |
| 2019 | $1,872 | $160,854 | $24,172 | $136,682 |
| 2018 | $1,751 | $157,701 | $23,699 | $134,002 |
| 2017 | $333 | $23,339 | $23,235 | $104 |
| 2016 | $316 | $22,882 | $22,780 | $102 |
| 2015 | $269 | $22,539 | $22,438 | $101 |
| 2014 | $263 | $22,099 | $21,999 | $100 |
Source: Public Records
Map
Nearby Homes
Your Personal Tour Guide
Ask me questions while you tour the home.