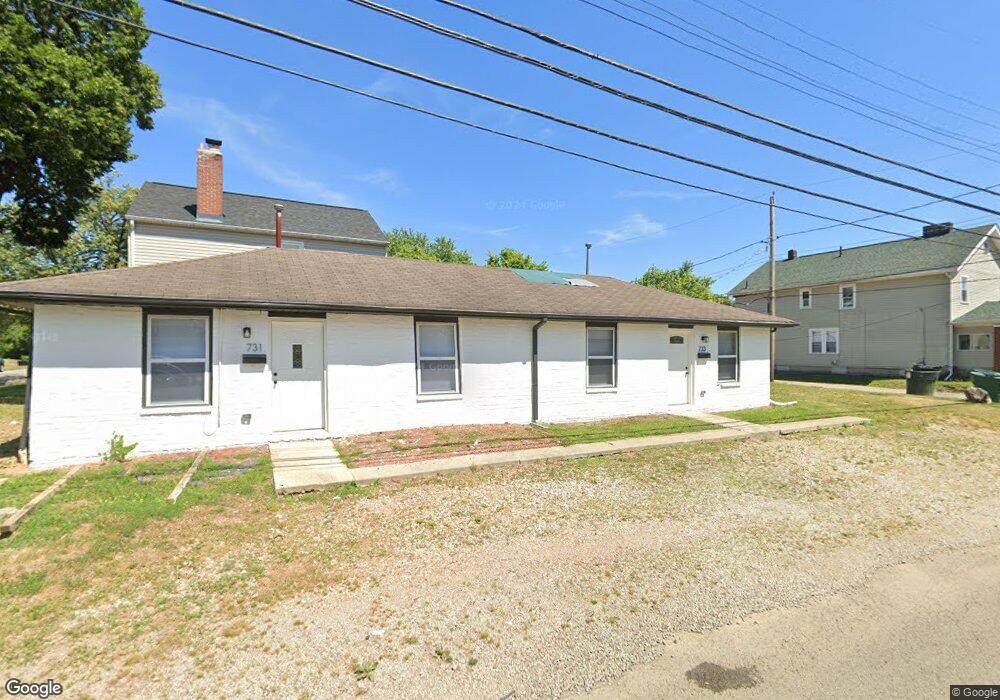
731 E Deshler Ave Unit 733 Columbus, OH 43206
Karns Park NeighborhoodEstimated Value: $163,000 - $217,000
4
Beds
2
Baths
1,254
Sq Ft
$150/Sq Ft
Est. Value
About This Home
This home is located at 731 E Deshler Ave Unit 733, Columbus, OH 43206 and is currently estimated at $188,031, approximately $149 per square foot. 731 E Deshler Ave Unit 733 is a home located in Franklin County with nearby schools including Lincoln Park Elementary School, South High School, and South Columbus Preparatory Academy.
Ownership History
Date
Name
Owned For
Owner Type
Purchase Details
Closed on
Mar 18, 2024
Sold by
Moore Revocable Living Trust and Moore James R
Bought by
Navigator Estates Llc
Current Estimated Value
Home Financials for this Owner
Home Financials are based on the most recent Mortgage that was taken out on this home.
Original Mortgage
$189,000
Interest Rate
6.9%
Mortgage Type
Construction
Purchase Details
Closed on
Feb 2, 2010
Sold by
Monaghan Stephan L and Monaghan Phyllis
Bought by
Moore James R and Moore Candi L
Purchase Details
Closed on
Jan 6, 2006
Sold by
Swanson Kelly V
Bought by
Monaghan Stephan L and Moore James R
Purchase Details
Closed on
Mar 23, 1996
Sold by
Swanson Kelly V
Bought by
Moore James R and Monaghan Stephen L
Purchase Details
Closed on
Oct 26, 1993
Bought by
Swanson Kelly
Purchase Details
Closed on
Aug 3, 1988
Create a Home Valuation Report for This Property
The Home Valuation Report is an in-depth analysis detailing your home's value as well as a comparison with similar homes in the area
Home Values in the Area
Average Home Value in this Area
Purchase History
| Date | Buyer | Sale Price | Title Company |
|---|---|---|---|
| Navigator Estates Llc | $157,000 | Landsel Title Agency | |
| Moore James R | -- | Attorney | |
| Monaghan Stephan L | $46,400 | Discovery T | |
| Moore James R | $46,330 | -- | |
| Swanson Kelly | $46,500 | -- | |
| -- | $45,500 | -- |
Source: Public Records
Mortgage History
| Date | Status | Borrower | Loan Amount |
|---|---|---|---|
| Closed | Navigator Estates Llc | $189,000 | |
| Closed | Moore James R | $0 |
Source: Public Records
Tax History Compared to Growth
Tax History
| Year | Tax Paid | Tax Assessment Tax Assessment Total Assessment is a certain percentage of the fair market value that is determined by local assessors to be the total taxable value of land and additions on the property. | Land | Improvement |
|---|---|---|---|---|
| 2024 | $2,974 | $64,900 | $22,790 | $42,110 |
| 2023 | $2,937 | $64,890 | $22,785 | $42,105 |
| 2022 | $1,025 | $19,290 | $5,500 | $13,790 |
| 2021 | $1,027 | $19,290 | $5,500 | $13,790 |
| 2020 | $1,028 | $19,290 | $5,500 | $13,790 |
| 2019 | $923 | $14,850 | $4,240 | $10,610 |
| 2018 | $1,110 | $14,850 | $4,240 | $10,610 |
| 2017 | $923 | $14,850 | $4,240 | $10,610 |
| 2016 | $1,427 | $21,000 | $3,990 | $17,010 |
| 2015 | $1,299 | $21,000 | $3,990 | $17,010 |
| 2014 | $1,302 | $21,000 | $3,990 | $17,010 |
| 2013 | $676 | $22,120 | $4,200 | $17,920 |
Source: Public Records
Map
Nearby Homes
- 1062 E Deshler Ave
- 739 Thurman Ave
- 1263 Heyl Ave
- 693 Thurman Ave
- 1191 S 22nd St Unit 1185
- 735-737 E Mithoff St
- 798 E Mithoff St
- 650 E Mithoff St
- 000 Gilbert St
- 00 Gilbert St
- 0 Gilbert St
- 853 Thurman Ave
- 1240 S 17th St
- 1064 Heyl Ave
- 524 Thurman Ave
- 1196 S Ohio Ave
- 718 Reinhard Ave
- 621-627 E Gates St
- 611 Siebert St
- 613 Siebert St
- 735 E Deshler Ave
- 739 E Deshler Ave
- 721 E Deshler Ave Unit 723
- 721 E Deshler Ave Unit 2
- 723 E Deshler Ave
- 1218 Heyl Ave
- 717 E Deshler Ave
- 1216 Heyl Ave Unit 218
- 1216 Heyl Ave Unit 2
- 1216-1218 Heyl Ave
- 1216-1218 Heyl Ave Unit 18
- 749 E Deshler Ave
- 1215 Heyl Ave
- 713 E Deshler Ave
- 1222 Heyl Ave
- 753 E Deshler Ave
- 732 E Deshler Ave Unit 734
- 738 E Deshler Ave
- 707 E Deshler Ave
- 742 E Deshler Ave