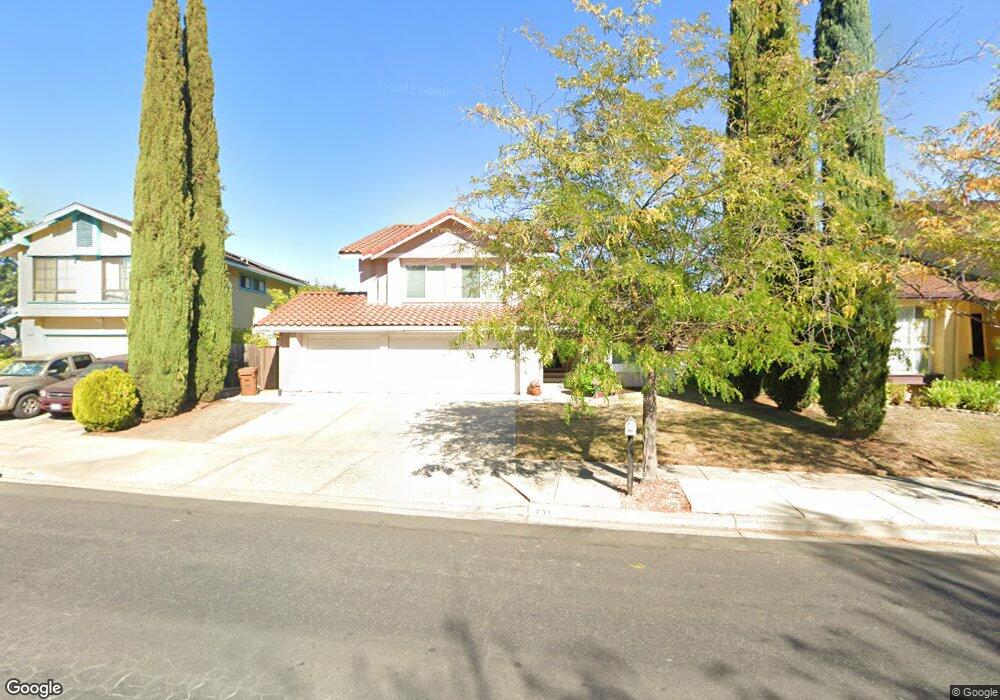
731 Hidden Lakes Dr Martinez, CA 94553
Hidden Valley NeighborhoodEstimated Value: $1,000,000 - $1,173,000
4
Beds
3
Baths
2,423
Sq Ft
$432/Sq Ft
Est. Value
About This Home
This home is located at 731 Hidden Lakes Dr, Martinez, CA 94553 and is currently estimated at $1,046,948, approximately $432 per square foot. 731 Hidden Lakes Dr is a home located in Contra Costa County with nearby schools including Hidden Valley Elementary School, Valley View Middle School, and College Park High School.
Ownership History
Date
Name
Owned For
Owner Type
Purchase Details
Closed on
Jan 29, 2021
Sold by
Shah Surpreet and Shah Anita
Bought by
Shah Supreet and Govind Anita
Current Estimated Value
Home Financials for this Owner
Home Financials are based on the most recent Mortgage that was taken out on this home.
Original Mortgage
$628,000
Outstanding Balance
$561,677
Interest Rate
2.7%
Mortgage Type
New Conventional
Estimated Equity
$485,271
Purchase Details
Closed on
Jan 14, 2021
Sold by
Patel Pravin G and Patel Bharati P
Bought by
Shah Surpreet and Govind Anita
Home Financials for this Owner
Home Financials are based on the most recent Mortgage that was taken out on this home.
Original Mortgage
$628,000
Outstanding Balance
$561,677
Interest Rate
2.7%
Mortgage Type
New Conventional
Estimated Equity
$485,271
Create a Home Valuation Report for This Property
The Home Valuation Report is an in-depth analysis detailing your home's value as well as a comparison with similar homes in the area
Home Values in the Area
Average Home Value in this Area
Purchase History
| Date | Buyer | Sale Price | Title Company |
|---|---|---|---|
| Shah Supreet | -- | Placer Title | |
| Shah Surpreet | $815,000 | Placer Title |
Source: Public Records
Mortgage History
| Date | Status | Borrower | Loan Amount |
|---|---|---|---|
| Open | Shah Supreet | $628,000 | |
| Previous Owner | Shah Surpreet | $628,000 |
Source: Public Records
Tax History Compared to Growth
Tax History
| Year | Tax Paid | Tax Assessment Tax Assessment Total Assessment is a certain percentage of the fair market value that is determined by local assessors to be the total taxable value of land and additions on the property. | Land | Improvement |
|---|---|---|---|---|
| 2025 | $6,746 | $537,430 | $140,417 | $397,013 |
| 2024 | $6,622 | $526,893 | $137,664 | $389,229 |
| 2023 | $6,622 | $516,563 | $134,965 | $381,598 |
| 2022 | $7,737 | $506,435 | $132,319 | $374,116 |
| 2021 | $6,377 | $496,506 | $129,725 | $366,781 |
| 2019 | $6,187 | $481,781 | $125,878 | $355,903 |
| 2018 | $6,039 | $472,335 | $123,410 | $348,925 |
| 2017 | $5,843 | $463,075 | $120,991 | $342,084 |
| 2016 | $5,695 | $453,996 | $118,619 | $335,377 |
| 2015 | $5,643 | $447,178 | $116,838 | $330,340 |
| 2014 | $5,558 | $438,420 | $114,550 | $323,870 |
Source: Public Records
Map
Nearby Homes
- 317 Lake Dale Ct
- 319 Oak Glen Ct
- 300 Lakehurst Dr
- 124 Fuschia Ct
- 104 Lupine Ln
- 301 Country View Ln
- 2162 Olympic Dr
- 14 Saint Louis Ln
- 896 Camelback Place
- 890 Camelback Place
- 126 Saint Joan Ln
- 318 Bentley Ct
- 8112 Camelback Place
- 394 Camelback Rd
- 3 Saint Louis Ln
- 94 Elder Dr Unit F
- 90 Elder Dr Unit C
- 1241 Raymond Dr
- 816 Camelback Place
- 112 Hemingway Common
- 721 Hidden Lakes Dr
- 741 Hidden Lakes Dr
- 310 Lake Reed Ct
- 314 Lake Brook Ct
- 320 Lake Brook Ct
- 314 Lake Reed Ct
- 751 Hidden Lakes Dr
- 324 Lake Brook Ct
- 304 Lake Reed Ct
- 2304 Lake Meadow Cir
- 320 Lake Reed Ct
- 330 Lake Brook Ct
- 730 Hidden Lakes Dr
- 310 Lake Brook Ct
- 720 Hidden Lakes Dr
- 324 Lake Reed Ct
- 740 Hidden Lakes Dr
- 300 Lake Reed Ct
- 2240 Lake Oaks Ct
- 334 Lake Brook Ct