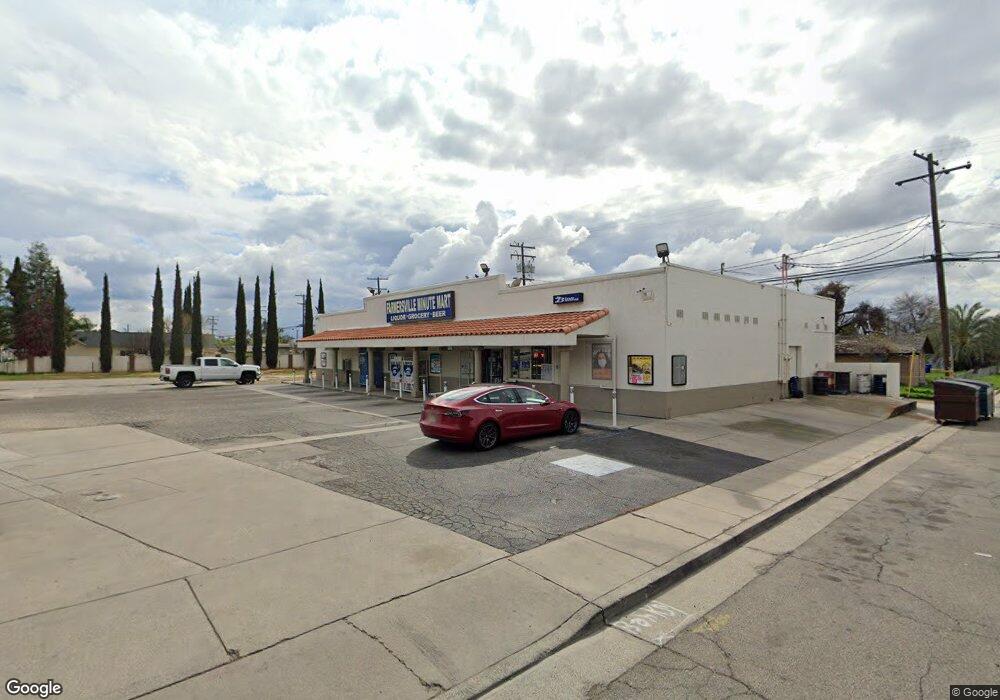
731 N Farmersville Blvd Farmersville, CA 93223
Estimated Value: $1,729,555
--
Bed
--
Bath
4,860
Sq Ft
$356/Sq Ft
Est. Value
About This Home
This home is located at 731 N Farmersville Blvd, Farmersville, CA 93223 and is currently priced at $1,729,555, approximately $355 per square foot. 731 N Farmersville Blvd is a home located in Tulare County with nearby schools including J.E. Hester Elementary School, George L. Snowden Elementary School, and Freedom Elementary School.
Ownership History
Date
Name
Owned For
Owner Type
Purchase Details
Closed on
Apr 26, 2024
Sold by
Golden Filling Station
Bought by
Big Al Property Llc
Current Estimated Value
Home Financials for this Owner
Home Financials are based on the most recent Mortgage that was taken out on this home.
Original Mortgage
$1,642,000
Interest Rate
6.46%
Mortgage Type
New Conventional
Purchase Details
Closed on
Jan 25, 2022
Sold by
Jang Bahadur Singh Sardar Singh Kuldip K
Bought by
Golden Filling Station
Home Financials for this Owner
Home Financials are based on the most recent Mortgage that was taken out on this home.
Original Mortgage
$2,000,000
Interest Rate
5.81%
Mortgage Type
New Conventional
Purchase Details
Closed on
Jun 10, 2010
Sold by
Yip Yong
Bought by
Singh Jang Bahadur and Singh Sardar
Home Financials for this Owner
Home Financials are based on the most recent Mortgage that was taken out on this home.
Original Mortgage
$508,300
Interest Rate
4.38%
Mortgage Type
Commercial
Purchase Details
Closed on
Jun 4, 2010
Sold by
Yip Yong
Bought by
Singh Jang Bahadur and Singh Sardar
Home Financials for this Owner
Home Financials are based on the most recent Mortgage that was taken out on this home.
Original Mortgage
$508,300
Interest Rate
4.38%
Mortgage Type
Commercial
Purchase Details
Closed on
Jun 1, 2010
Sold by
Tran Tou
Bought by
Tran Judy Yan
Home Financials for this Owner
Home Financials are based on the most recent Mortgage that was taken out on this home.
Original Mortgage
$508,300
Interest Rate
4.38%
Mortgage Type
Commercial
Purchase Details
Closed on
Oct 5, 2005
Sold by
Tran Tou
Bought by
Tran Judy Yan
Purchase Details
Closed on
Aug 1, 2005
Sold by
Chea Kevin Chy
Bought by
Yip Yong and Tran Judy Yan
Home Financials for this Owner
Home Financials are based on the most recent Mortgage that was taken out on this home.
Original Mortgage
$650,000
Interest Rate
5.63%
Mortgage Type
Commercial
Purchase Details
Closed on
Sep 18, 2003
Sold by
Giotta Pete
Bought by
Chea Kevin Chy and Chea Kevin C
Home Financials for this Owner
Home Financials are based on the most recent Mortgage that was taken out on this home.
Original Mortgage
$320,000
Interest Rate
5.8%
Mortgage Type
Commercial
Purchase Details
Closed on
Jun 30, 1999
Sold by
Marshall Kenneth W
Bought by
Giotta Pete and Mirizzi Angelo
Create a Home Valuation Report for This Property
The Home Valuation Report is an in-depth analysis detailing your home's value as well as a comparison with similar homes in the area
Home Values in the Area
Average Home Value in this Area
Purchase History
| Date | Buyer | Sale Price | Title Company |
|---|---|---|---|
| Big Al Property Llc | $1,300,000 | Chicago Title | |
| Golden Filling Station | $1,600,000 | New Title Company Name | |
| Singh Jang Bahadur | -- | Placer Title Company | |
| Singh Jang Bahadur | $550,000 | Placer Title Company | |
| Yip Yong | -- | Placer Title Company | |
| Tran Judy Yan | -- | Placer Title Company | |
| Tran Judy Yan | -- | Chicago Title Co | |
| Yip Yong | -- | Chicago Title Co | |
| Chea Kevin Chy | -- | Chicago Title Co | |
| Yip Yong | $1,000,000 | Chicago Title Co | |
| Chea Kevin Chy | $400,000 | Chicago Title Co | |
| Giotta Pete | $11,500 | Fidelity National Title |
Source: Public Records
Mortgage History
| Date | Status | Borrower | Loan Amount |
|---|---|---|---|
| Previous Owner | Big Al Property Llc | $1,642,000 | |
| Previous Owner | Golden Filling Station | $2,000,000 | |
| Previous Owner | Singh Jang Bahadur | $508,300 | |
| Previous Owner | Yip Yong | $650,000 | |
| Previous Owner | Chea Kevin Chy | $320,000 |
Source: Public Records
Tax History Compared to Growth
Tax History
| Year | Tax Paid | Tax Assessment Tax Assessment Total Assessment is a certain percentage of the fair market value that is determined by local assessors to be the total taxable value of land and additions on the property. | Land | Improvement |
|---|---|---|---|---|
| 2025 | $19,242 | $1,300,000 | $150,000 | $1,150,000 |
| 2024 | $19,242 | $1,731,352 | $153,000 | $1,578,352 |
| 2023 | $19,323 | $1,699,352 | $150,000 | $1,549,352 |
| 2022 | $8,532 | $793,818 | $84,510 | $709,308 |
| 2021 | $8,267 | $768,998 | $82,853 | $686,145 |
| 2020 | $8,158 | $751,594 | $82,003 | $669,591 |
| 2019 | $8,181 | $737,437 | $80,395 | $657,042 |
| 2018 | $8,110 | $730,862 | $78,819 | $652,043 |
| 2017 | $8,196 | $722,729 | $77,274 | $645,455 |
| 2016 | $7,957 | $721,804 | $75,759 | $646,045 |
| 2015 | $7,792 | $721,113 | $74,621 | $646,492 |
| 2014 | $7,792 | $713,858 | $73,159 | $640,699 |
Source: Public Records
Map
Nearby Homes
- 701 Farmersville Rd
- 896 Farmersville Rd
- 0 S Farmersville Blvd Unit 238390
- 438 N Magnolia Ave
- 322 E Citrus Dr
- 680 E Larry St
- 209 S Magnolia Ave
- 738 E Larry St
- 885 E Ash St
- 903 E Ash St
- 327 S Farmersville Blvd
- 896 N Mariposa Ave
- 732 N Dwight Ave
- 1643 Tehama Ave
- 0 Avenue 288
- 528 S Camelia Ave
- 0 Avenue 288
- 753 N Brundage Ave
- 245 W Oakland St
- 0 Apn 128-030-056-000 Unit 218742
- 769 N Farmersville Blvd
- 175 W Cottonwood St
- 730 N Linnell Ave
- 704 N Linnell Ave
- 160 W Cottonwood St
- 665 N Farmersville Blvd Unit 2
- 665 N Farmersville Blvd
- 686 N Linnell Ave
- 778 N Linnell Ave
- 666 N Linnell Ave
- 180 W Yew St
- 780 N Linnell Ave
- 794 N Farmersville Blvd
- 656 N Farmersville Blvd
- 640 Farmersville Rd
- 723 N Magnolia Ave
- 811 N Farmersville Blvd
- 192 E Pepper St
- 741 N Magnolia Ave
- 713 N Linnell Ave