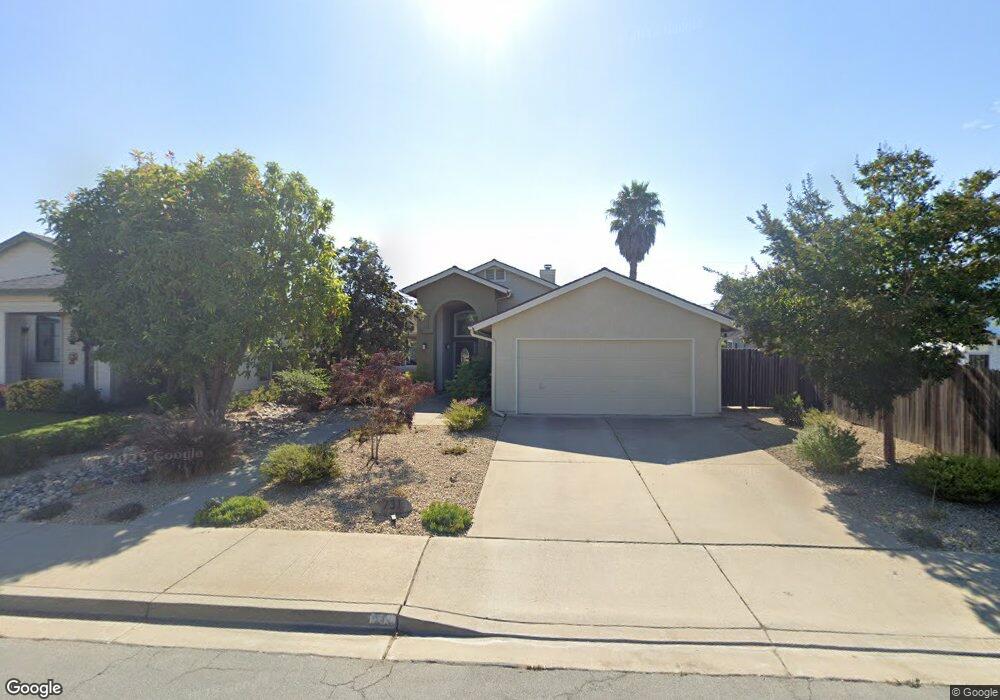
731 Phoebe St Nipomo, CA 93444
Estimated Value: $705,672 - $917,000
3
Beds
2
Baths
1,466
Sq Ft
$521/Sq Ft
Est. Value
About This Home
This home is located at 731 Phoebe St, Nipomo, CA 93444 and is currently estimated at $763,418, approximately $520 per square foot. 731 Phoebe St is a home located in San Luis Obispo County with nearby schools including Dana Elementary School, Mesa Middle School, and Nipomo High School.
Ownership History
Date
Name
Owned For
Owner Type
Purchase Details
Closed on
Nov 29, 2011
Sold by
Johnson Randy P
Bought by
Johnson Randy P
Current Estimated Value
Purchase Details
Closed on
Aug 27, 2010
Sold by
Johnson Randy P
Bought by
Johnson Randy P
Purchase Details
Closed on
Oct 15, 2008
Sold by
Johnson Randy P
Bought by
Johnson Randy P
Create a Home Valuation Report for This Property
The Home Valuation Report is an in-depth analysis detailing your home's value as well as a comparison with similar homes in the area
Home Values in the Area
Average Home Value in this Area
Purchase History
| Date | Buyer | Sale Price | Title Company |
|---|---|---|---|
| Johnson Randy P | -- | None Available | |
| Johnson Randy P | -- | None Available | |
| Johnson Randy P | -- | None Available |
Source: Public Records
Tax History
| Year | Tax Paid | Tax Assessment Tax Assessment Total Assessment is a certain percentage of the fair market value that is determined by local assessors to be the total taxable value of land and additions on the property. | Land | Improvement |
|---|---|---|---|---|
| 2025 | $2,374 | $236,181 | $101,164 | $135,017 |
| 2024 | $2,345 | $231,551 | $99,181 | $132,370 |
| 2023 | $2,345 | $227,012 | $97,237 | $129,775 |
| 2022 | $2,309 | $222,562 | $95,331 | $127,231 |
| 2021 | $2,303 | $218,199 | $93,462 | $124,737 |
| 2020 | $2,276 | $215,962 | $92,504 | $123,458 |
| 2019 | $2,261 | $211,729 | $90,691 | $121,038 |
| 2018 | $2,233 | $207,578 | $88,913 | $118,665 |
| 2017 | $2,190 | $203,509 | $87,170 | $116,339 |
| 2016 | $2,065 | $199,519 | $85,461 | $114,058 |
| 2015 | $2,034 | $196,523 | $84,178 | $112,345 |
| 2014 | $1,958 | $192,675 | $82,530 | $110,145 |
Source: Public Records
Map
Nearby Homes
- 483 Violet Ave
- 689 Phoebe St
- 522 Higos Way
- 345 Black Hawk Way
- 325 Black Hawk Way
- 330 Kestrel Way
- 368 Avenida de Amigos
- 450 Avenida de Socios Unit 5
- 640 Honey Grove Ln
- 525 Grande Ave Unit D
- 945 Jeanette Ln
- 680 Hill St
- 426 Polaris Dr
- 719 W Tefft St
- 571 S Oakglen Ave
- 567 S Oakglen Ave
- 565 S Oakglen Ave
- 424 Bermuda Place
- 353 Uranus Ct
- 449 W Tefft St
Your Personal Tour Guide
Ask me questions while you tour the home.