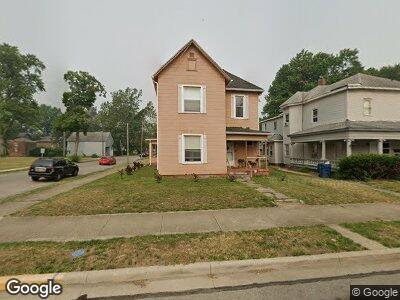
731 S 7th St Unit 2 Terre Haute, IN 47807
Farringtons Grove NeighborhoodEstimated Value: $109,816 - $173,000
1
Bed
1
Bath
500
Sq Ft
$267/Sq Ft
Est. Value
About This Home
This home is located at 731 S 7th St Unit 2, Terre Haute, IN 47807 and is currently estimated at $133,704, approximately $267 per square foot. 731 S 7th St Unit 2 is a home located in Vigo County with nearby schools including Farrington Grove Elementary School, Sarah Scott Middle School, and Terre Haute South Vigo High School.
Ownership History
Date
Name
Owned For
Owner Type
Purchase Details
Closed on
Aug 27, 2020
Sold by
Woolard Gerri A and Woolard Dudley E
Bought by
Lynch Investments Llc
Current Estimated Value
Home Financials for this Owner
Home Financials are based on the most recent Mortgage that was taken out on this home.
Original Mortgage
$62,400
Outstanding Balance
$56,125
Interest Rate
2.9%
Mortgage Type
Future Advance Clause Open End Mortgage
Estimated Equity
$88,094
Purchase Details
Closed on
Apr 30, 2013
Sold by
Brown Gerri A and Woolard Gerri A
Bought by
Woolard Gerri A and Woolard Dudley E
Create a Home Valuation Report for This Property
The Home Valuation Report is an in-depth analysis detailing your home's value as well as a comparison with similar homes in the area
Home Values in the Area
Average Home Value in this Area
Purchase History
| Date | Buyer | Sale Price | Title Company |
|---|---|---|---|
| Lynch Investments Llc | -- | None Available | |
| Woolard Gerri A | -- | None Available |
Source: Public Records
Mortgage History
| Date | Status | Borrower | Loan Amount |
|---|---|---|---|
| Open | Lynch Investments Llc | $62,400 |
Source: Public Records
Tax History Compared to Growth
Tax History
| Year | Tax Paid | Tax Assessment Tax Assessment Total Assessment is a certain percentage of the fair market value that is determined by local assessors to be the total taxable value of land and additions on the property. | Land | Improvement |
|---|---|---|---|---|
| 2024 | $2,906 | $134,400 | $10,100 | $124,300 |
| 2023 | $2,772 | $128,200 | $10,100 | $118,100 |
| 2022 | $2,543 | $117,600 | $10,100 | $107,500 |
| 2021 | $2,194 | $100,800 | $9,900 | $90,900 |
| 2020 | $2,022 | $92,900 | $9,100 | $83,800 |
| 2019 | $1,861 | $85,700 | $8,400 | $77,300 |
| 2018 | $1,678 | $83,300 | $8,100 | $75,200 |
| 2017 | $1,608 | $79,900 | $7,900 | $72,000 |
| 2016 | $1,592 | $79,600 | $7,900 | $71,700 |
| 2014 | $1,542 | $77,100 | $7,400 | $69,700 |
| 2013 | $1,542 | $73,900 | $9,800 | $64,100 |
Source: Public Records
Map
Nearby Homes