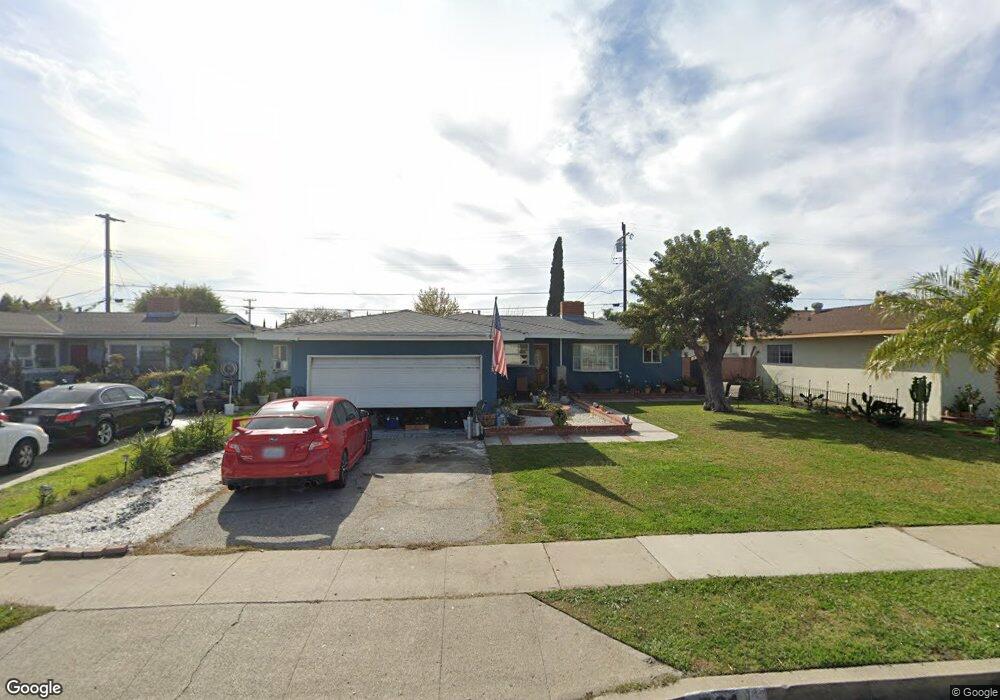
731 S Dover St Anaheim, CA 92805
North Anaheim NeighborhoodEstimated Value: $834,369 - $905,000
4
Beds
2
Baths
1,355
Sq Ft
$646/Sq Ft
Est. Value
About This Home
This home is located at 731 S Dover St, Anaheim, CA 92805 and is currently estimated at $875,092, approximately $645 per square foot. 731 S Dover St is a home located in Orange County with nearby schools including Theodore Roosevelt Elementary School, South Junior High School, and Katella High School.
Ownership History
Date
Name
Owned For
Owner Type
Purchase Details
Closed on
Mar 3, 2020
Sold by
Zarth Willie H
Bought by
Zarth Willi H and Cruz Maria Delaluz
Current Estimated Value
Home Financials for this Owner
Home Financials are based on the most recent Mortgage that was taken out on this home.
Original Mortgage
$250,000
Outstanding Balance
$221,829
Interest Rate
3.6%
Mortgage Type
New Conventional
Estimated Equity
$653,263
Purchase Details
Closed on
Sep 22, 2000
Sold by
Elizabeth Adams
Bought by
Zarth Willi H and Zarth Angeles
Home Financials for this Owner
Home Financials are based on the most recent Mortgage that was taken out on this home.
Original Mortgage
$168,750
Interest Rate
7.96%
Purchase Details
Closed on
Jun 21, 1995
Sold by
Loose Thomas and Loose Jany
Bought by
Zarth Willi H and Zarth Angeles
Home Financials for this Owner
Home Financials are based on the most recent Mortgage that was taken out on this home.
Original Mortgage
$144,650
Interest Rate
7.59%
Create a Home Valuation Report for This Property
The Home Valuation Report is an in-depth analysis detailing your home's value as well as a comparison with similar homes in the area
Home Values in the Area
Average Home Value in this Area
Purchase History
| Date | Buyer | Sale Price | Title Company |
|---|---|---|---|
| Zarth Willi H | -- | Western Resources Title Co | |
| Zarth Willi H | -- | -- | |
| Zarth Willi H | $152,500 | Orange Coast Title |
Source: Public Records
Mortgage History
| Date | Status | Borrower | Loan Amount |
|---|---|---|---|
| Open | Zarth Willi H | $250,000 | |
| Closed | Zarth Willi H | $168,750 | |
| Previous Owner | Zarth Willi H | $144,650 |
Source: Public Records
Tax History Compared to Growth
Tax History
| Year | Tax Paid | Tax Assessment Tax Assessment Total Assessment is a certain percentage of the fair market value that is determined by local assessors to be the total taxable value of land and additions on the property. | Land | Improvement |
|---|---|---|---|---|
| 2025 | $3,267 | $274,136 | $189,312 | $84,824 |
| 2024 | $3,267 | $268,761 | $185,600 | $83,161 |
| 2023 | $3,195 | $263,492 | $181,961 | $81,531 |
| 2022 | $3,151 | $258,326 | $178,393 | $79,933 |
| 2021 | $3,153 | $253,261 | $174,895 | $78,366 |
| 2020 | $3,138 | $250,665 | $173,102 | $77,563 |
| 2019 | $3,047 | $245,750 | $169,707 | $76,043 |
| 2018 | $2,984 | $240,932 | $166,380 | $74,552 |
| 2017 | $2,869 | $236,208 | $163,117 | $73,091 |
| 2016 | $2,858 | $231,577 | $159,919 | $71,658 |
| 2015 | $2,831 | $228,099 | $157,517 | $70,582 |
| 2014 | $2,661 | $223,631 | $154,431 | $69,200 |
Source: Public Records
Map
Nearby Homes
- 554 S Elder St
- 1615 E South St
- 700 S Plymouth Place
- 516 S State College Blvd
- 1415 E South St
- 1730 E Park St
- 1750 E Park St
- 1700 E Park St
- 2227 E Westport Dr
- 1720 E Park St
- 1720 E Park St Unit 12
- Plan 1394 at Sunflower
- Plan 1810 Modeled at Sunflower
- Plan 1771 at Sunflower
- Plan 1827 at Sunflower
- Plan 1378 Modeled at Sunflower
- 2443 E Westport Cir
- 2420 E Agave St Unit 6
- 2420 E Lincoln Ave Unit 2
- 2420 E Lincoln Ave Unit 3
- 735 S Dover St
- 725 S Dover St
- 716 S Dorchester St
- 721 S Dover St
- 720 S Dorchester St
- 710 S Dorchester St
- 1839 E South St Unit 48
- 739 S Dover St
- 1859 E South St Unit 38
- 1902 E Dover Place
- 726 S Dorchester St
- 706 S Dorchester St
- 715 S Dover St
- 1903 E South St
- 1891 E South St Unit 112
- 1891 E South St Unit 110
- 1903 E Dover Place
- 1908 E Dover Place
- 700 S Dorchester St
- 1909 E South St