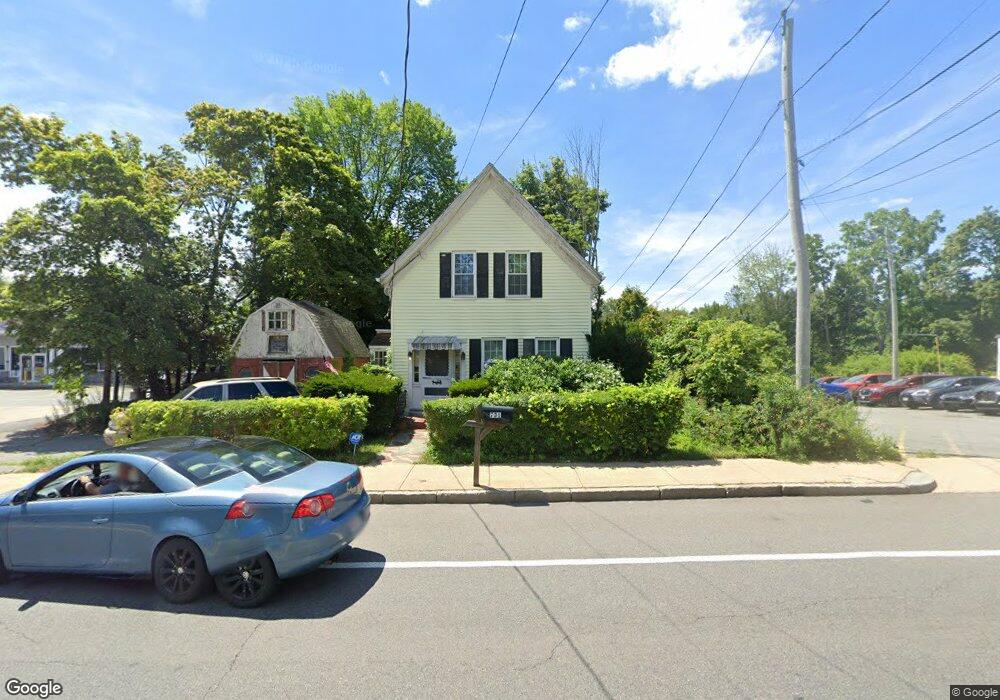
731 S Main St Randolph, MA 02368
South Randolph NeighborhoodEstimated Value: $482,000 - $526,000
3
Beds
1
Bath
1,364
Sq Ft
$366/Sq Ft
Est. Value
About This Home
This home is located at 731 S Main St, Randolph, MA 02368 and is currently estimated at $499,817, approximately $366 per square foot. 731 S Main St is a home located in Norfolk County with nearby schools including Randolph High School and Lighthouse Baptist Christian Academy.
Ownership History
Date
Name
Owned For
Owner Type
Purchase Details
Closed on
May 16, 2025
Sold by
Nelson Lillian M
Bought by
Nelson Linda and Zygiel Phyllis N
Current Estimated Value
Purchase Details
Closed on
Sep 18, 2023
Sold by
Nelson Linwood J
Bought by
Nelson Lillian M
Create a Home Valuation Report for This Property
The Home Valuation Report is an in-depth analysis detailing your home's value as well as a comparison with similar homes in the area
Home Values in the Area
Average Home Value in this Area
Purchase History
| Date | Buyer | Sale Price | Title Company |
|---|---|---|---|
| Nelson Linda | -- | None Available | |
| Nelson Linda | -- | None Available | |
| Nelson Lillian M | -- | None Available | |
| Nelson Lillian M | -- | None Available |
Source: Public Records
Tax History
| Year | Tax Paid | Tax Assessment Tax Assessment Total Assessment is a certain percentage of the fair market value that is determined by local assessors to be the total taxable value of land and additions on the property. | Land | Improvement |
|---|---|---|---|---|
| 2025 | $4,479 | $385,810 | $182,110 | $203,700 |
| 2024 | $4,397 | $384,047 | $178,547 | $205,500 |
| 2023 | $4,093 | $338,789 | $162,289 | $176,500 |
| 2022 | $3,989 | $293,291 | $135,191 | $158,100 |
| 2021 | $3,770 | $255,096 | $112,696 | $142,400 |
| 2020 | $3,686 | $247,196 | $112,696 | $134,500 |
| 2019 | $3,532 | $235,800 | $107,400 | $128,400 |
| 2018 | $3,340 | $210,300 | $97,500 | $112,800 |
| 2017 | $3,666 | $226,600 | $93,000 | $133,600 |
| 2016 | $3,539 | $203,500 | $84,500 | $119,000 |
| 2015 | $3,381 | $186,800 | $80,400 | $106,400 |
Source: Public Records
Map
Nearby Homes
Your Personal Tour Guide
Ask me questions while you tour the home.