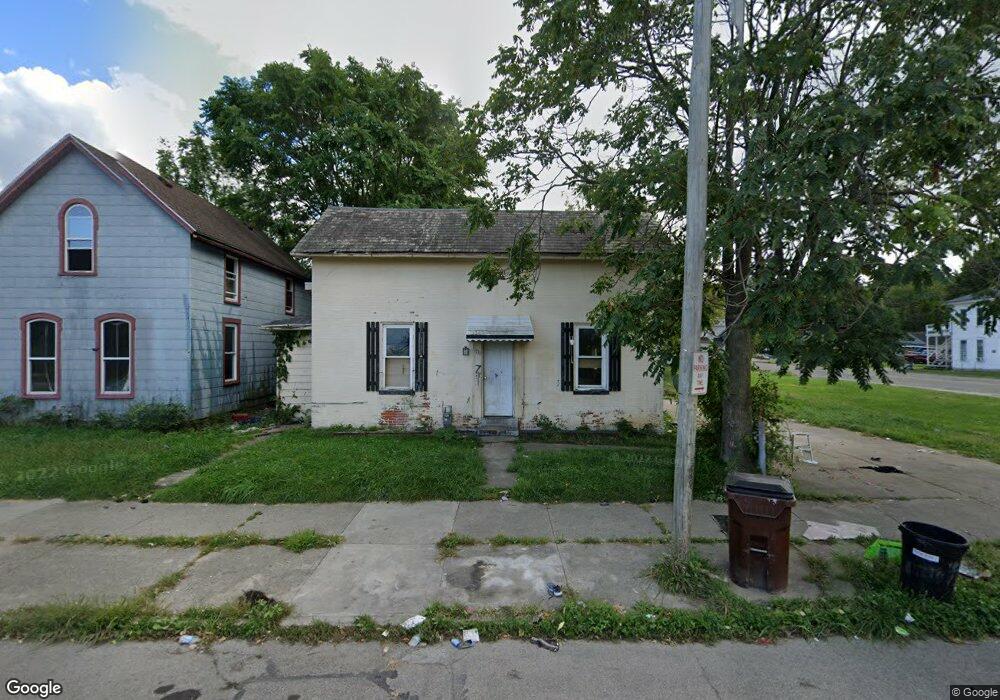
731 W Main St Springfield, OH 45504
Estimated Value: $47,000 - $138,000
3
Beds
1
Bath
1,294
Sq Ft
$69/Sq Ft
Est. Value
About This Home
This home is located at 731 W Main St, Springfield, OH 45504 and is currently estimated at $88,973, approximately $68 per square foot. 731 W Main St is a home located in Clark County with nearby schools including Snyder Park Elementary School, Roosevelt Middle School, and Springfield High School.
Ownership History
Date
Name
Owned For
Owner Type
Purchase Details
Closed on
May 13, 2022
Sold by
Hdld Llc
Bought by
Ohio Green Properties Llc
Current Estimated Value
Home Financials for this Owner
Home Financials are based on the most recent Mortgage that was taken out on this home.
Original Mortgage
$490,000
Interest Rate
5.78%
Mortgage Type
Balloon
Purchase Details
Closed on
Apr 19, 2014
Sold by
Dooley Herbert G and Dooley Terry
Bought by
Hdld Llc
Purchase Details
Closed on
Jul 18, 2012
Sold by
Carter Avery R
Bought by
Dooley Herbert G and Dooley Terry
Purchase Details
Closed on
May 5, 1995
Sold by
Day Air Credit Union Inc
Bought by
Carter Avery R and Carter Evelyn
Home Financials for this Owner
Home Financials are based on the most recent Mortgage that was taken out on this home.
Original Mortgage
$25,050
Interest Rate
8.43%
Mortgage Type
FHA
Purchase Details
Closed on
Jun 1, 1979
Create a Home Valuation Report for This Property
The Home Valuation Report is an in-depth analysis detailing your home's value as well as a comparison with similar homes in the area
Home Values in the Area
Average Home Value in this Area
Purchase History
| Date | Buyer | Sale Price | Title Company |
|---|---|---|---|
| Ohio Green Properties Llc | $31,200 | Welch Legal Services Llc | |
| Ohio Green Properties Llc | $31,200 | None Listed On Document | |
| Hdld Llc | -- | Attorney | |
| Dooley Herbert G | $6,699 | None Available | |
| Carter Avery R | $22,500 | -- | |
| -- | $20,500 | -- |
Source: Public Records
Mortgage History
| Date | Status | Borrower | Loan Amount |
|---|---|---|---|
| Previous Owner | Ohio Green Properties Llc | $490,000 | |
| Previous Owner | Carter Avery R | $25,050 |
Source: Public Records
Tax History
| Year | Tax Paid | Tax Assessment Tax Assessment Total Assessment is a certain percentage of the fair market value that is determined by local assessors to be the total taxable value of land and additions on the property. | Land | Improvement |
|---|---|---|---|---|
| 2025 | $442 | $12,440 | $2,940 | $9,500 |
| 2024 | $431 | $8,730 | $2,390 | $6,340 |
| 2023 | $663 | $8,730 | $2,390 | $6,340 |
| 2022 | $442 | $8,730 | $2,390 | $6,340 |
| 2021 | $390 | $7,100 | $2,100 | $5,000 |
| 2020 | $391 | $7,100 | $2,100 | $5,000 |
| 2019 | $392 | $7,100 | $2,100 | $5,000 |
| 2018 | $391 | $6,800 | $2,100 | $4,700 |
| 2017 | $391 | $6,801 | $2,097 | $4,704 |
| 2016 | $391 | $6,801 | $2,097 | $4,704 |
| 2015 | $399 | $6,801 | $2,097 | $4,704 |
| 2014 | $397 | $6,801 | $2,097 | $4,704 |
| 2013 | $393 | $6,801 | $2,097 | $4,704 |
Source: Public Records
Map
Nearby Homes
- 727 W High St
- 101`103 N Western
- 820 W North St
- 217-219 N Race St
- 239 N Shaffer St
- 222 N Race St Unit 224
- 709-711 W Mulberry St
- 1205 W High St
- 1225 W High St
- 423 N Jackson St Unit 425
- 1124 W Mulberry St
- 525 S Light St
- 412 Dakota Ave
- 1230 W Pleasant St
- 366 N Isabella St
- 207 N Bechtle Ave Unit 209
- 306 N Bechtle Ave
- 1362 W Mulberry St Unit 1364
- 1374 W Mulberry St
- 1420 Parker Ct
- 729 W Main St
- 725 W Main St
- 14 S Shaffer St
- 721 W Main St
- 18 S Shaffer St
- 732 Court St
- 22 S Shaffer St
- 726 Court St
- 715 W Main St
- 809 W Main St
- 709 W Main St
- 21 S Shaffer St Unit 23
- 800 W Main St
- 716 Court St
- 740 W High St Unit 742
- 736 W High St
- 806 W Main St Unit 808
- 11 N Shaffer St Unit 13
- 802 W High St Unit 804
- 17 S Light St Unit 23
Your Personal Tour Guide
Ask me questions while you tour the home.