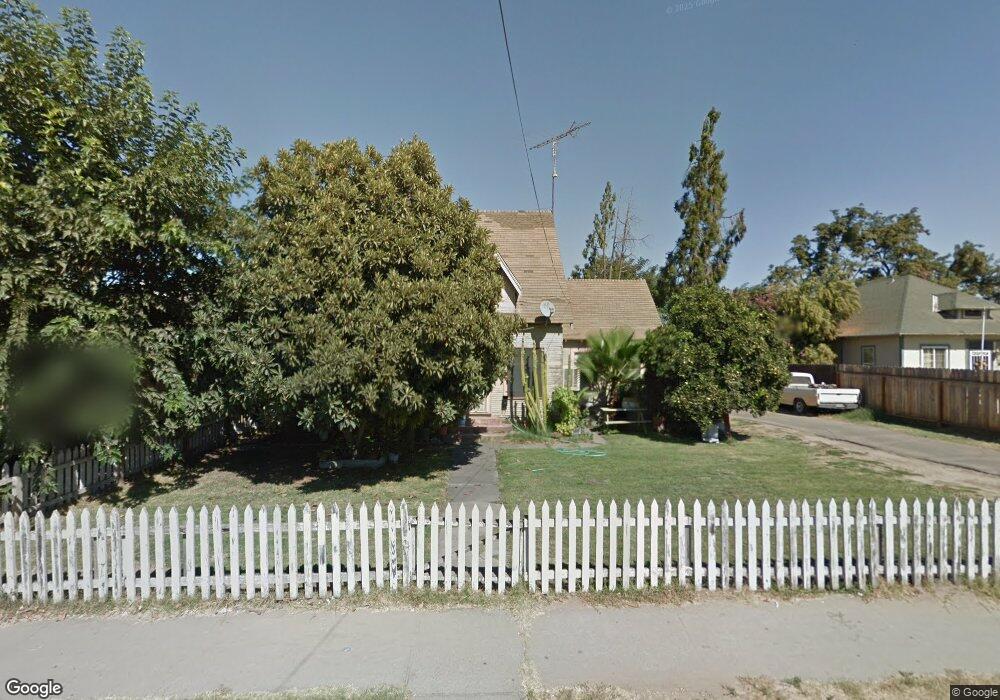
731 W Main St Turlock, CA 95380
Downtown Turlock NeighborhoodEstimated Value: $310,000 - $495,000
4
Beds
2
Baths
1,470
Sq Ft
$261/Sq Ft
Est. Value
About This Home
This home is located at 731 W Main St, Turlock, CA 95380 and is currently estimated at $383,045, approximately $260 per square foot. 731 W Main St is a home located in Stanislaus County with nearby schools including Wakefield Elementary School, Marvin A. Dutcher Middle School, and Turlock Junior High School.
Ownership History
Date
Name
Owned For
Owner Type
Purchase Details
Closed on
Mar 26, 1998
Sold by
Olano Janice and Olano Alfred E
Bought by
Pedroza Arturo and Pedroza Simona
Current Estimated Value
Home Financials for this Owner
Home Financials are based on the most recent Mortgage that was taken out on this home.
Original Mortgage
$50,000
Interest Rate
7.17%
Mortgage Type
Seller Take Back
Purchase Details
Closed on
Apr 13, 1997
Sold by
Olano Janice
Bought by
Olano Victor F and Olano Janice E
Create a Home Valuation Report for This Property
The Home Valuation Report is an in-depth analysis detailing your home's value as well as a comparison with similar homes in the area
Home Values in the Area
Average Home Value in this Area
Purchase History
| Date | Buyer | Sale Price | Title Company |
|---|---|---|---|
| Pedroza Arturo | $50,000 | Transcounty Title Company | |
| Olano Victor F | -- | -- |
Source: Public Records
Mortgage History
| Date | Status | Borrower | Loan Amount |
|---|---|---|---|
| Previous Owner | Pedroza Arturo | $50,000 |
Source: Public Records
Tax History
| Year | Tax Paid | Tax Assessment Tax Assessment Total Assessment is a certain percentage of the fair market value that is determined by local assessors to be the total taxable value of land and additions on the property. | Land | Improvement |
|---|---|---|---|---|
| 2025 | $828 | $83,809 | $44,696 | $39,113 |
| 2024 | $811 | $82,167 | $43,820 | $38,347 |
| 2023 | $808 | $80,557 | $42,961 | $37,596 |
| 2022 | $797 | $78,978 | $42,119 | $36,859 |
| 2021 | $784 | $77,431 | $41,294 | $36,137 |
| 2020 | $778 | $76,638 | $40,871 | $35,767 |
| 2019 | $763 | $75,136 | $40,070 | $35,066 |
| 2018 | $761 | $73,664 | $39,285 | $34,379 |
| 2017 | $742 | $72,220 | $38,515 | $33,705 |
| 2016 | $691 | $70,805 | $37,760 | $33,045 |
| 2015 | $683 | $69,742 | $37,193 | $32,549 |
| 2014 | $675 | $68,377 | $36,465 | $31,912 |
Source: Public Records
Map
Nearby Homes
- 350 West Ave S
- 350 West Ave N
- 545 W Main St
- 830 Flower St
- 591 High St
- 801 Flower St
- 526 Flower St
- 250 Davis St
- 374 W Main St
- 541 Justin Dr
- 531 Justin Dr
- 556 Vermont Ave
- 1065 Vermont Ave
- 312 W Main St
- 1270 Magic Sands Way
- 900 W Canal Dr Unit 100
- 900 W Canal Dr Unit 114
- 230 Vermont Ave
- 1253 Magic Sands Way
- 243 Angelus St
Your Personal Tour Guide
Ask me questions while you tour the home.