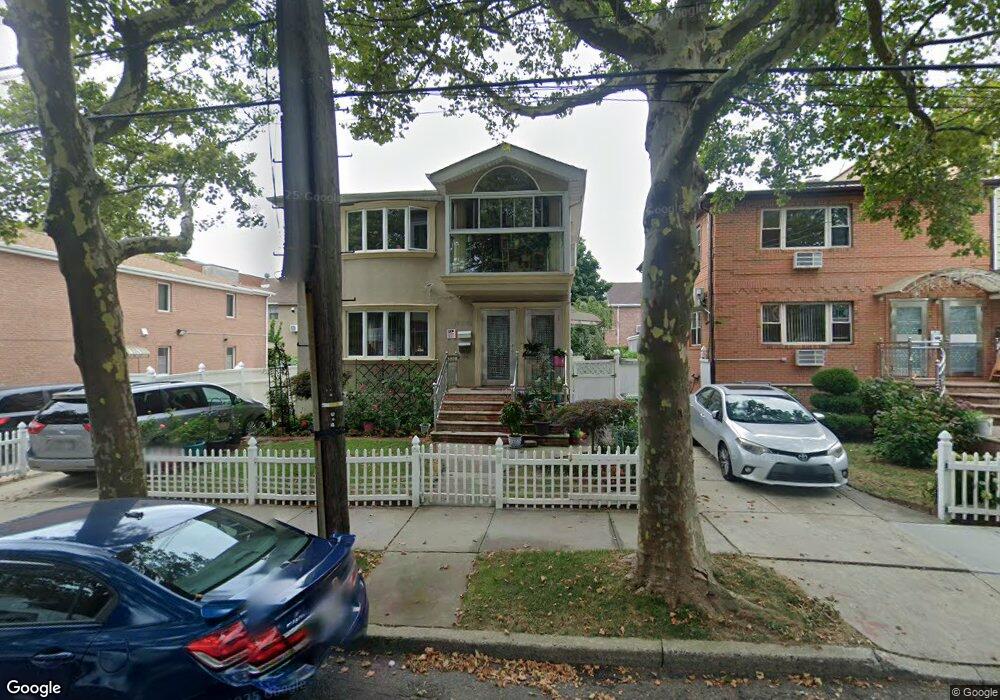
7310 162nd St Fresh Meadows, NY 11366
Kew Gardens Hills NeighborhoodEstimated Value: $1,186,000 - $1,506,000
3
Beds
2
Baths
1,400
Sq Ft
$989/Sq Ft
Est. Value
About This Home
This home is located at 7310 162nd St, Fresh Meadows, NY 11366 and is currently estimated at $1,384,082, approximately $988 per square foot. 7310 162nd St is a home located in Queens County with nearby schools including I.S. 250 - The Robert F. Kennedy Community Middle School and Al-Mamoor School.
Ownership History
Date
Name
Owned For
Owner Type
Purchase Details
Closed on
May 4, 2010
Sold by
Du Ping
Bought by
Wang Jialin
Current Estimated Value
Purchase Details
Closed on
Oct 2, 2008
Sold by
Atone Yehuda
Bought by
Du Ping and Wang Lan
Home Financials for this Owner
Home Financials are based on the most recent Mortgage that was taken out on this home.
Original Mortgage
$533,850
Interest Rate
6.41%
Mortgage Type
Purchase Money Mortgage
Purchase Details
Closed on
Aug 23, 2007
Sold by
Vanbrackle June M
Bought by
Atone Yehuda
Home Financials for this Owner
Home Financials are based on the most recent Mortgage that was taken out on this home.
Original Mortgage
$468,000
Interest Rate
6.74%
Mortgage Type
Purchase Money Mortgage
Purchase Details
Closed on
Aug 31, 2000
Sold by
Wallace George S and Wallace Mavis K
Bought by
Wallace George S
Create a Home Valuation Report for This Property
The Home Valuation Report is an in-depth analysis detailing your home's value as well as a comparison with similar homes in the area
Home Values in the Area
Average Home Value in this Area
Purchase History
| Date | Buyer | Sale Price | Title Company |
|---|---|---|---|
| Wang Jialin | -- | -- | |
| Wang Jialin | -- | -- | |
| Du Ping | $910,000 | -- | |
| Du Ping | $910,000 | -- | |
| Atone Yehuda | $585,000 | -- | |
| Atone Yehuda | $585,000 | -- | |
| Wallace George S | -- | -- | |
| Wallace George S | -- | -- |
Source: Public Records
Mortgage History
| Date | Status | Borrower | Loan Amount |
|---|---|---|---|
| Previous Owner | Du Ping | $533,850 | |
| Previous Owner | Atone Yehuda | $468,000 |
Source: Public Records
Tax History Compared to Growth
Tax History
| Year | Tax Paid | Tax Assessment Tax Assessment Total Assessment is a certain percentage of the fair market value that is determined by local assessors to be the total taxable value of land and additions on the property. | Land | Improvement |
|---|---|---|---|---|
| 2025 | $7,588 | $41,579 | $8,281 | $33,298 |
| 2024 | $3,516 | $41,578 | $8,836 | $32,742 |
| 2023 | $3,289 | $40,346 | $9,433 | $30,913 |
| 2022 | $3,151 | $72,660 | $17,100 | $55,560 |
| 2021 | $3,175 | $60,240 | $17,100 | $43,140 |
| 2020 | $2,079 | $66,240 | $17,100 | $49,140 |
| 2019 | $6,026 | $66,060 | $17,100 | $48,960 |
| 2018 | $6,556 | $33,622 | $7,945 | $25,677 |
| 2017 | $6,213 | $31,946 | $8,738 | $23,208 |
| 2016 | $5,761 | $31,946 | $8,738 | $23,208 |
| 2015 | $3,415 | $28,874 | $11,795 | $17,079 |
| 2014 | $3,415 | $28,874 | $12,590 | $16,284 |
Source: Public Records
Map
Nearby Homes
- 163-07 72nd Ave Unit 5C
- 163-07 72nd Ave Unit 5A
- 163-07 72nd Ave Unit 2D
- 163-07 72nd Ave Unit 2G
- 163-07 72nd Ave Unit 4E
- 163-07 72nd Ave Unit 2C
- 163-07 72nd Ave Unit 5F
- 163-07 72nd Ave Unit 5b
- 163-07 72nd Ave Unit 2A
- 163-07 72nd Ave Unit 4H
- 7506 164th St
- 160-06 75th Rd Fesh Meadow Unit 3
- 7177 159th St Unit 3D
- 72-05 164th St
- 71-33 162nd St Unit 4B
- 7129 Sutton Place Unit 3
- 160-20 76th Ave
- 71-28 Sutton Place Unit 3
- 164-22 73rd Ave
- 71-34 163rd St Unit 3
- 7310 162nd St
- 7310 162nd St
- 7306 162nd St
- 7306 162nd St Unit 2F
- 7304 162nd St
- 7314 162nd St
- 16043 75th Ave
- 16030 73rd Ave
- 16033 75th Ave
- 16028 73rd Ave
- 16028 73rd Ave Unit 1
- 16028 73rd Ave Unit HOUSE
- 16028 73rd Ave
- 16029 75th Ave
- 7313 162nd St
- 7309 162nd St
- 73-09 162nd St Unit 1
- 7305 162nd St
- 16024 73rd Ave