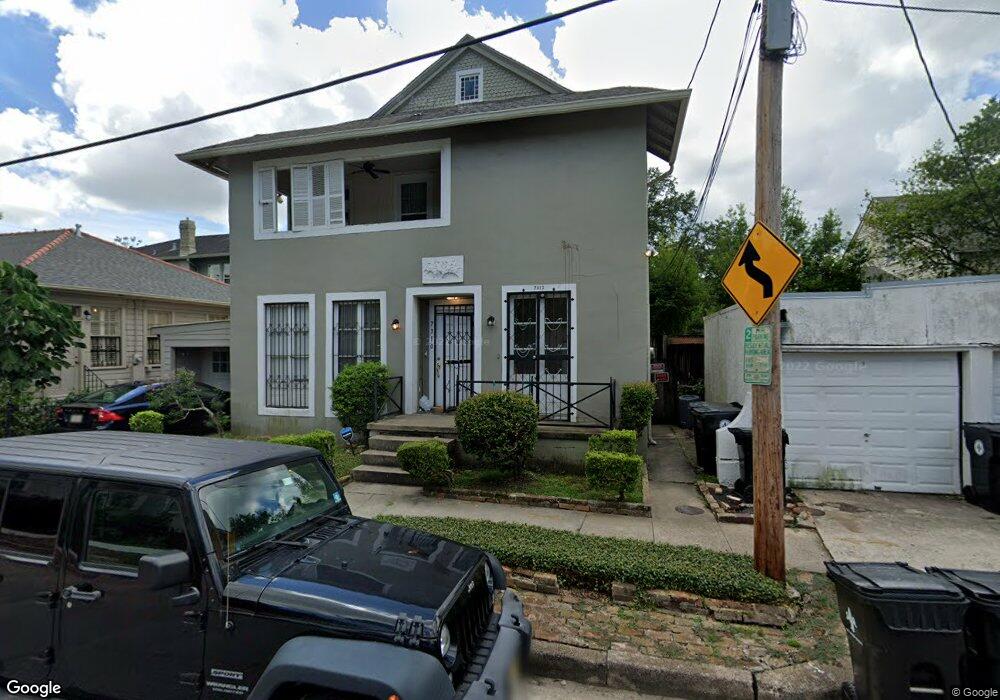
7310 Maple St New Orleans, LA 70118
Audubon NeighborhoodEstimated Value: $363,000 - $855,000
4
Beds
2
Baths
1,782
Sq Ft
$361/Sq Ft
Est. Value
About This Home
This home is located at 7310 Maple St, New Orleans, LA 70118 and is currently estimated at $642,898, approximately $360 per square foot. 7310 Maple St is a home located in Orleans Parish with nearby schools including Audubon Uptown Lower School, Kipp Believe College Prep (Phillips), and The Willow School New Orleans.
Ownership History
Date
Name
Owned For
Owner Type
Purchase Details
Closed on
Apr 8, 2015
Sold by
Patton Minnette W
Bought by
Nony Llc
Current Estimated Value
Purchase Details
Closed on
Oct 24, 2014
Sold by
Nony Llc
Bought by
Patton Clyde E
Home Financials for this Owner
Home Financials are based on the most recent Mortgage that was taken out on this home.
Original Mortgage
$382,300
Interest Rate
4.25%
Mortgage Type
New Conventional
Purchase Details
Closed on
Oct 5, 2006
Sold by
Claiborne Vanessa L B
Bought by
Patton Clyde E and Wallace,Michelle
Home Financials for this Owner
Home Financials are based on the most recent Mortgage that was taken out on this home.
Original Mortgage
$311,400
Interest Rate
6.41%
Create a Home Valuation Report for This Property
The Home Valuation Report is an in-depth analysis detailing your home's value as well as a comparison with similar homes in the area
Home Values in the Area
Average Home Value in this Area
Purchase History
| Date | Buyer | Sale Price | Title Company |
|---|---|---|---|
| Nony Llc | -- | -- | |
| Patton Clyde E | -- | -- | |
| Patton Clyde E | $346,000 | -- |
Source: Public Records
Mortgage History
| Date | Status | Borrower | Loan Amount |
|---|---|---|---|
| Previous Owner | Patton Clyde E | $382,300 | |
| Previous Owner | Patton Clyde E | $311,400 |
Source: Public Records
Tax History Compared to Growth
Tax History
| Year | Tax Paid | Tax Assessment Tax Assessment Total Assessment is a certain percentage of the fair market value that is determined by local assessors to be the total taxable value of land and additions on the property. | Land | Improvement |
|---|---|---|---|---|
| 2025 | $8,218 | $62,260 | $9,450 | $52,810 |
| 2024 | $8,342 | $62,260 | $9,450 | $52,810 |
| 2023 | $7,002 | $57,130 | $6,300 | $50,830 |
| 2022 | $7,002 | $49,760 | $6,300 | $43,460 |
| 2021 | $8,224 | $57,130 | $6,300 | $50,830 |
| 2020 | $5,958 | $40,980 | $6,300 | $34,680 |
| 2019 | $6,191 | $40,980 | $6,300 | $34,680 |
| 2018 | $6,314 | $40,980 | $6,300 | $34,680 |
| 2017 | $6,029 | $40,980 | $6,300 | $34,680 |
| 2016 | $4,997 | $32,920 | $7,880 | $25,040 |
| 2015 | $4,894 | $32,920 | $7,880 | $25,040 |
| 2014 | -- | $32,920 | $7,880 | $25,040 |
| 2013 | -- | $32,920 | $7,880 | $25,040 |
Source: Public Records
Map
Nearby Homes
- 820 Lowerline St
- 732 Cherokee St Unit 305
- 732 Cherokee St Unit 302
- 7444 St Charles Ave Unit 303
- 535 Lowerline St
- 7014 Saint Charles Ave Unit K
- 7518 Zimpel St
- 501 03 Lowerline St
- Lot 13 Audubon Place
- 400 Millaudon St
- 470 Pine St
- 629 Burdette St
- 27 Audubon Place
- 710 Burdette St
- 7713 Zimpel St
- 411 Lowerline St Unit D
- 7522 Benjamin St Unit 110