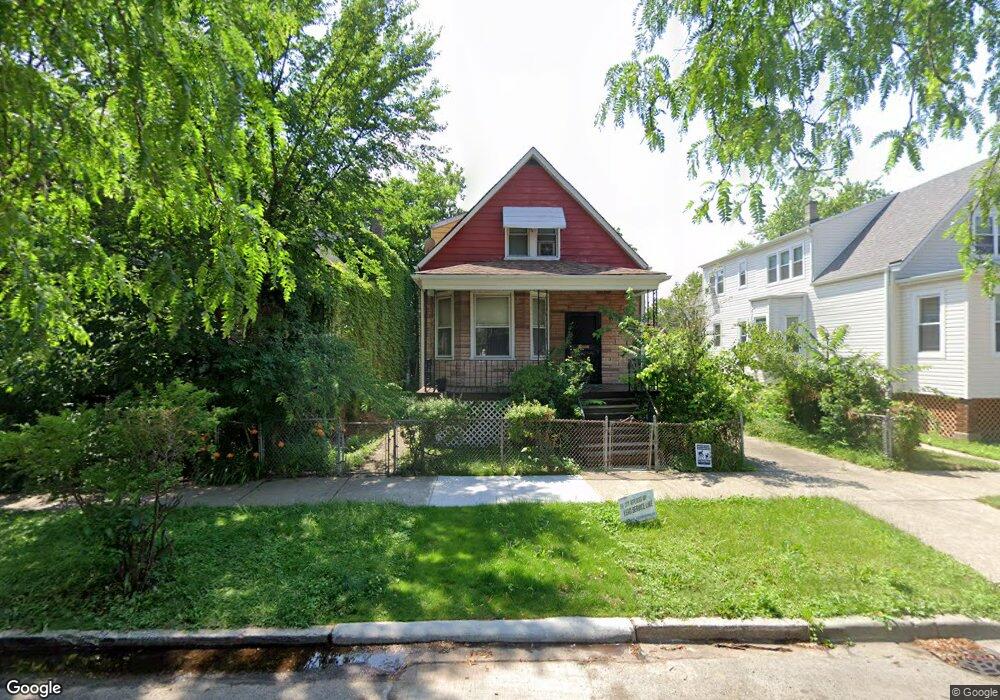
7310 S Marshfield Ave Chicago, IL 60636
Englewood NeighborhoodEstimated Value: $156,000 - $271,000
3
Beds
2
Baths
2,005
Sq Ft
$101/Sq Ft
Est. Value
About This Home
This home is located at 7310 S Marshfield Ave, Chicago, IL 60636 and is currently estimated at $201,978, approximately $100 per square foot. 7310 S Marshfield Ave is a home located in Cook County with nearby schools including Randolph Elementary School and The Montessori School of Englewood Charter School.
Ownership History
Date
Name
Owned For
Owner Type
Purchase Details
Closed on
Jun 9, 2012
Sold by
Ahmed Zaheer
Bought by
Guidance Residential Llc
Current Estimated Value
Create a Home Valuation Report for This Property
The Home Valuation Report is an in-depth analysis detailing your home's value as well as a comparison with similar homes in the area
Home Values in the Area
Average Home Value in this Area
Purchase History
| Date | Buyer | Sale Price | Title Company |
|---|---|---|---|
| Guidance Residential Llc | -- | None Available |
Source: Public Records
Tax History Compared to Growth
Tax History
| Year | Tax Paid | Tax Assessment Tax Assessment Total Assessment is a certain percentage of the fair market value that is determined by local assessors to be the total taxable value of land and additions on the property. | Land | Improvement |
|---|---|---|---|---|
| 2024 | $355 | $8,700 | $1,406 | $7,294 |
| 2023 | $325 | $5,000 | $2,574 | $2,426 |
| 2022 | $325 | $5,000 | $2,574 | $2,426 |
| 2021 | $335 | $4,998 | $2,573 | $2,425 |
| 2020 | $1,184 | $8,417 | $3,046 | $5,371 |
| 2019 | $1,190 | $9,353 | $3,046 | $6,307 |
| 2018 | $1,169 | $9,353 | $3,046 | $6,307 |
| 2017 | $1,343 | $9,612 | $2,812 | $6,800 |
| 2016 | $1,425 | $9,612 | $2,812 | $6,800 |
| 2015 | $1,281 | $9,612 | $2,812 | $6,800 |
| 2014 | $1,633 | $11,370 | $2,577 | $8,793 |
| 2013 | $1,590 | $11,370 | $2,577 | $8,793 |
Source: Public Records
Map
Nearby Homes
- 7253 S Marshfield Ave
- 7241 S Marshfield Ave
- 7244 S Paulina St
- 7225 S Paulina St
- 7243 S Hermitage Ave
- 7228 S Hermitage Ave
- 7219 S Wood St
- 7252 S Wood St
- 1508 W 72nd St
- 1467 W 73rd St
- 7330 S Wood St
- 7149 S Wood St
- 7349 S Honore St
- 1445 W 73rd St
- 7133 S Honore St
- 1809 W 71st St
- 1500 W 71st St
- 1723 W 75th Place
- 7017 S Hermitage Ave
- 7010 S Paulina St
- 7312 S Marshfield Ave
- 7312 S Marshfield Ave
- 7304 S Marshfield Ave
- 7302 S Marshfield Ave
- 1639 W 73rd St
- 1637 W 73rd St
- 1637 W 73rd St
- 1637 W 73rd St Unit 2E
- 1637 W 73rd St Unit 1E
- 7320 S Marshfield Ave
- 7322 S Marshfield Ave
- 7311 S Paulina St
- 7311 S Paulina St Unit 1
- 7311 S Paulina St Unit 2
- 7309 S Paulina St
- 7313 S Paulina St
- 7305 S Paulina St
- 7317 S Paulina St
- 7324 S Marshfield Ave
- 7303 S Paulina St