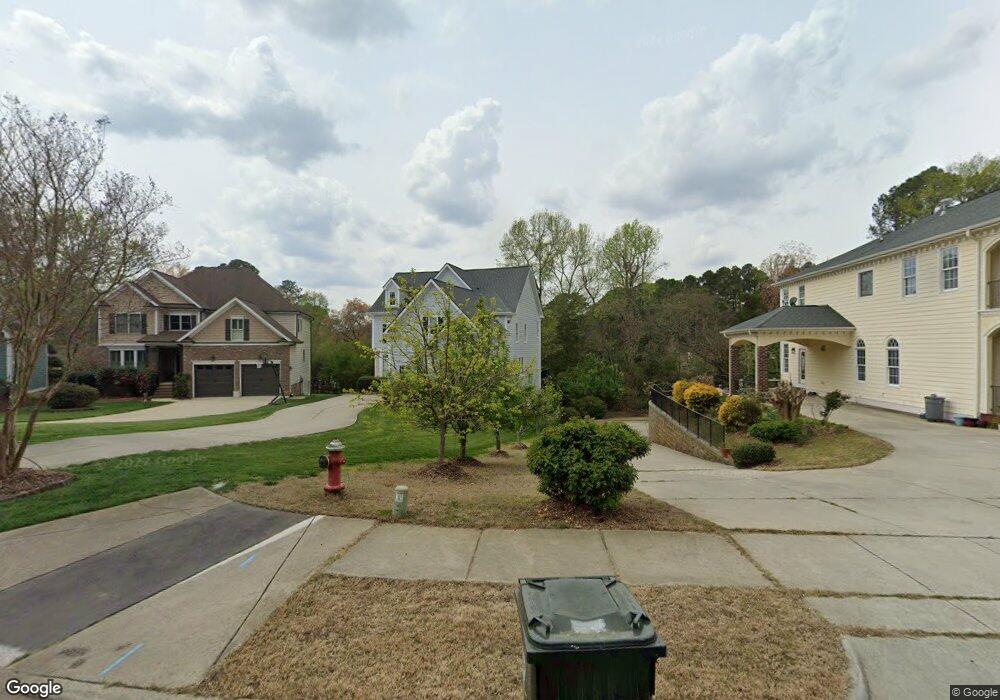
7311 Newport Ave Raleigh, NC 27613
Estimated Value: $892,000 - $983,000
5
Beds
5
Baths
4,469
Sq Ft
$208/Sq Ft
Est. Value
About This Home
This home is located at 7311 Newport Ave, Raleigh, NC 27613 and is currently estimated at $928,475, approximately $207 per square foot. 7311 Newport Ave is a home located in Wake County with nearby schools including York Elementary School, Leesville Road Middle School, and Leesville Road High School.
Ownership History
Date
Name
Owned For
Owner Type
Purchase Details
Closed on
Jul 23, 2015
Sold by
Primestar Fund I Trs Inc
Bought by
Carter Aaron M and Carter Ashley M
Current Estimated Value
Home Financials for this Owner
Home Financials are based on the most recent Mortgage that was taken out on this home.
Original Mortgage
$417,000
Outstanding Balance
$327,632
Interest Rate
4.08%
Mortgage Type
New Conventional
Estimated Equity
$600,843
Purchase Details
Closed on
Nov 5, 2013
Sold by
Primestar Fund I Lp
Bought by
Primestar Fund I Trs Inc
Purchase Details
Closed on
Jun 28, 2013
Sold by
Young Derwin L and Alston Johnelle C
Bought by
Primestar Fund I Lp
Purchase Details
Closed on
Dec 22, 2006
Sold by
Homestead Building Co
Bought by
Alston Johnelle C and Young Derwin L
Home Financials for this Owner
Home Financials are based on the most recent Mortgage that was taken out on this home.
Original Mortgage
$508,000
Interest Rate
6.5%
Mortgage Type
Construction
Create a Home Valuation Report for This Property
The Home Valuation Report is an in-depth analysis detailing your home's value as well as a comparison with similar homes in the area
Home Values in the Area
Average Home Value in this Area
Purchase History
| Date | Buyer | Sale Price | Title Company |
|---|---|---|---|
| Carter Aaron M | $440,000 | Attorney | |
| Primestar Fund I Trs Inc | -- | None Available | |
| Primestar Fund I Lp | $470,000 | None Available | |
| Alston Johnelle C | $505,000 | None Available |
Source: Public Records
Mortgage History
| Date | Status | Borrower | Loan Amount |
|---|---|---|---|
| Open | Carter Aaron M | $417,000 | |
| Previous Owner | Alston Johnelle C | $508,000 |
Source: Public Records
Tax History Compared to Growth
Tax History
| Year | Tax Paid | Tax Assessment Tax Assessment Total Assessment is a certain percentage of the fair market value that is determined by local assessors to be the total taxable value of land and additions on the property. | Land | Improvement |
|---|---|---|---|---|
| 2025 | $6,920 | $791,143 | $160,000 | $631,143 |
| 2024 | $6,891 | $791,143 | $160,000 | $631,143 |
| 2023 | $5,901 | $539,567 | $80,000 | $459,567 |
| 2022 | $5,483 | $539,567 | $80,000 | $459,567 |
| 2021 | $5,270 | $539,567 | $80,000 | $459,567 |
| 2020 | $5,174 | $539,567 | $80,000 | $459,567 |
| 2019 | $5,519 | $474,464 | $80,000 | $394,464 |
| 2018 | $5,204 | $474,464 | $80,000 | $394,464 |
| 2017 | $4,956 | $474,464 | $80,000 | $394,464 |
| 2016 | $4,854 | $474,464 | $80,000 | $394,464 |
| 2015 | -- | $504,711 | $94,000 | $410,711 |
| 2014 | $4,975 | $504,711 | $94,000 | $410,711 |
Source: Public Records
Map
Nearby Homes
- 4416 Lancashire Dr
- 4541 Hershey Ct
- 4424 Tetbury Place
- 4536 Hamptonshire Dr
- 6648 Mafolie Ct
- 7108 Sandringham Dr
- 6036 Epping Forest Dr
- 6736 Hammersmith Dr
- 6600 Coach Light Cir
- 6928 Leesville Rd
- 6051 Epping Forest Dr
- 4104 Betterton Dr
- 104 Oak Hollow Ct Unit 104
- 401 Oak Hollow Ct Unit 401
- 202 Oak Hollow Ct
- 6422 Tanner Oak Ln
- 6420 Tanner Oak Ln
- 6408 Tanner Oak Ln
- 204 Autumn Chase Dr Unit 204
- 4211 Norman Ridge Ln
- 7307 Newport Ave
- 7321 Newport Ave
- 7301 Newport Ave
- 6912 Chamonix Place
- 6908 Chamonix Place
- 7325 Newport Ave
- 7223 Newport Ave
- 6916 Chamonix Place
- 4328 Craddock Rd
- 4324 Craddock Rd
- 6904 Chamonix Place
- 7329 Newport Ave
- 4320 Craddock Rd
- 6920 Chamonix Place
- 7219 Newport Ave
- 4332 Craddock Rd
- 7333 Newport Ave
- 4316 Craddock Rd
- 7215 Newport Ave
- 6924 Chamonix Place