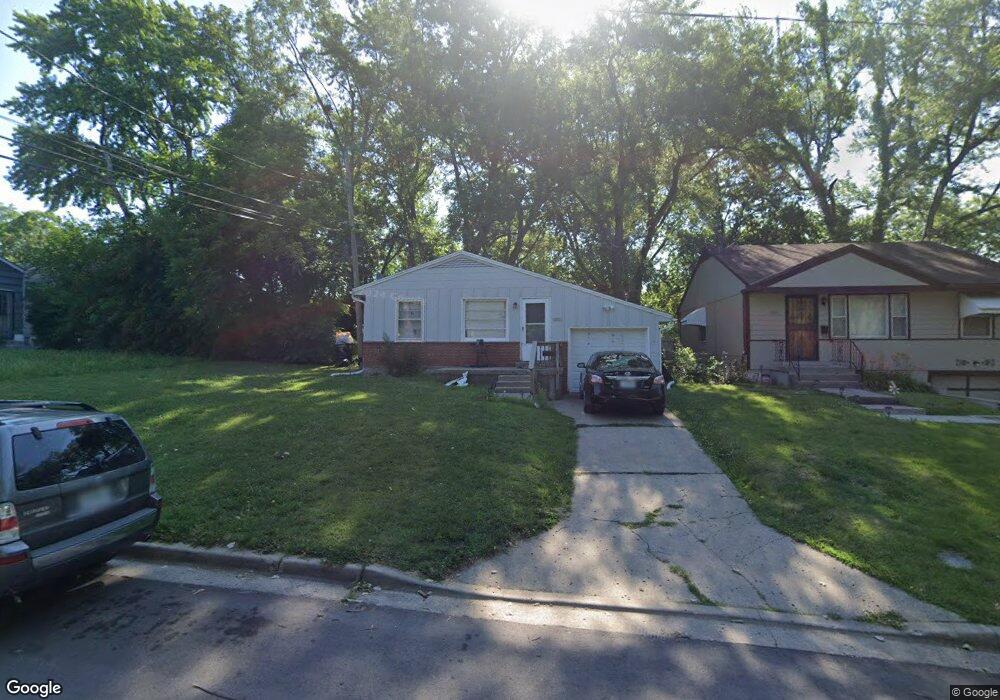
7311 S Benton Ave Kansas City, MO 64132
Noble And Gregory Ridge NeighborhoodEstimated Value: $85,000 - $130,000
2
Beds
1
Bath
1,270
Sq Ft
$79/Sq Ft
Est. Value
About This Home
This home is located at 7311 S Benton Ave, Kansas City, MO 64132 and is currently estimated at $99,938, approximately $78 per square foot. 7311 S Benton Ave is a home located in Jackson County with nearby schools including Benjamin Banneker Elementary School, Central Middle School, and Southeast High School.
Ownership History
Date
Name
Owned For
Owner Type
Purchase Details
Closed on
Apr 8, 2021
Sold by
Arlington Benton Llc
Bought by
A House Divided Llc
Current Estimated Value
Purchase Details
Closed on
Oct 18, 2019
Sold by
Arlington Estates Llc
Bought by
Arlington Benton Llc
Purchase Details
Closed on
Oct 17, 2018
Sold by
Hodgin Sonia
Bought by
Arlington Estates Llc
Home Financials for this Owner
Home Financials are based on the most recent Mortgage that was taken out on this home.
Original Mortgage
$60,200
Interest Rate
4.5%
Mortgage Type
New Conventional
Purchase Details
Closed on
Jan 29, 2018
Sold by
Solenberger Construction Llc
Bought by
Hodgin Sonia
Home Financials for this Owner
Home Financials are based on the most recent Mortgage that was taken out on this home.
Original Mortgage
$3,800
Interest Rate
3.94%
Mortgage Type
New Conventional
Purchase Details
Closed on
Sep 29, 2016
Sold by
G & L Associates Llc
Bought by
Solenberger Construction Llc
Create a Home Valuation Report for This Property
The Home Valuation Report is an in-depth analysis detailing your home's value as well as a comparison with similar homes in the area
Home Values in the Area
Average Home Value in this Area
Purchase History
| Date | Buyer | Sale Price | Title Company |
|---|---|---|---|
| A House Divided Llc | -- | Act | |
| Arlington Benton Llc | -- | None Available | |
| Arlington Estates Llc | -- | Accurate Title Co | |
| Hodgin Sonia | -- | Alpha Title Guaranty Inc | |
| Solenberger Construction Llc | -- | Alpha Title Llc |
Source: Public Records
Mortgage History
| Date | Status | Borrower | Loan Amount |
|---|---|---|---|
| Previous Owner | Arlington Estates Llc | $60,200 | |
| Previous Owner | Hodgin Sonia | $3,800 |
Source: Public Records
Tax History Compared to Growth
Tax History
| Year | Tax Paid | Tax Assessment Tax Assessment Total Assessment is a certain percentage of the fair market value that is determined by local assessors to be the total taxable value of land and additions on the property. | Land | Improvement |
|---|---|---|---|---|
| 2025 | $982 | $4,021 | $2,670 | $1,351 |
| 2024 | $982 | $12,436 | $2,373 | $10,063 |
| 2023 | $972 | $12,436 | $1,129 | $11,307 |
| 2022 | $250 | $3,040 | $1,511 | $1,529 |
| 2021 | $249 | $3,040 | $1,511 | $1,529 |
| 2020 | $256 | $3,086 | $1,511 | $1,575 |
| 2019 | $251 | $3,086 | $1,511 | $1,575 |
| 2018 | $397 | $4,987 | $972 | $4,015 |
| 2017 | $397 | $4,987 | $972 | $4,015 |
| 2016 | $389 | $4,862 | $591 | $4,271 |
| 2014 | $390 | $4,862 | $591 | $4,271 |
Source: Public Records
Map
Nearby Homes
- 3913 E 73rd St
- 2650 NE 74th Terrace
- 7325 Walrond Ave
- 7119 Bellefontaine Ave
- 7103 Agnes Ave
- 7115 Bellefontaine Ave
- 7216 Indiana Ave
- 7040 Agnes Ave
- 7426 Indiana Ave
- 7012 S Benton Ave
- 7233 Park Ave
- 2216 E 73rd St
- 2304 E 75th St
- 3500 E 75th St
- 2422 E 70th Terrace
- 6947 Bellefontaine Ave
- 7015 College Ave
- 7300 Brooklyn Ave
- 7557 Olive St
- 6933 Walrond Ave
- 7315 S Benton Ave
- 7317 S Benton Ave
- 7301 S Benton Ave
- 7310 S Benton Ave
- 7314 S Benton Ave
- 7321 S Benton Ave
- 2907 E 73rd St
- 7318 S Benton Ave
- 2905 E 73rd St
- 7300 S Benton Ave
- 2917 E 73rd St
- 2817 E 73rd St
- 2919 E 73rd St
- 7312 Agnes Ave
- 2815 E 73rd St
- 7314 Agnes Ave
- 7316 Agnes Ave
- 2902 E 73rd St
- 2925 E 73rd St
- 2811 E 73rd St