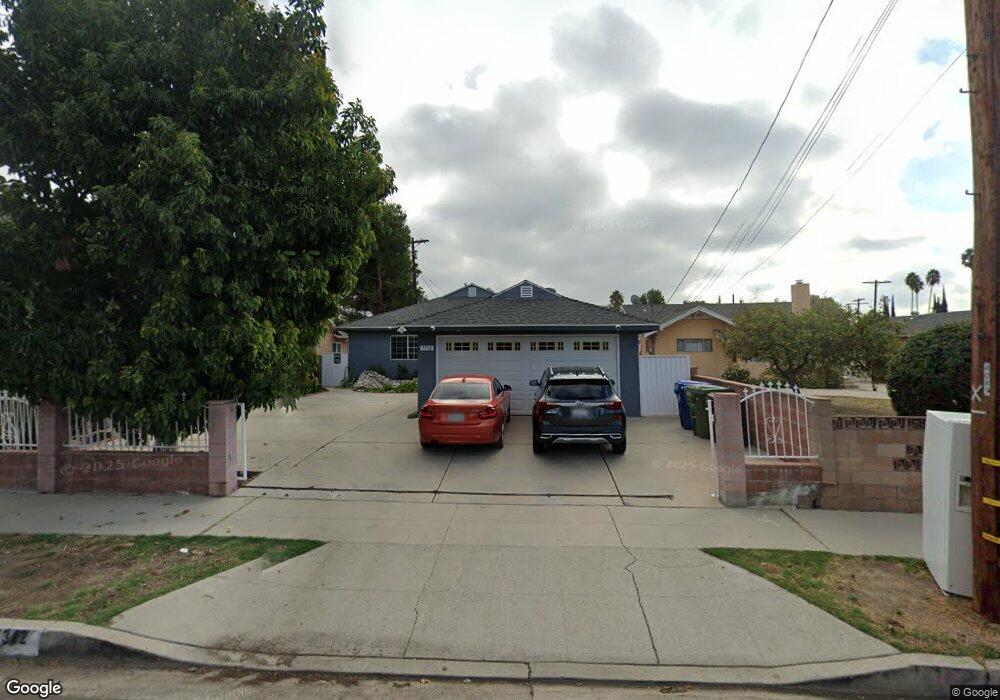
7312 Vanalden Ave Reseda, CA 91335
Estimated Value: $860,000 - $1,001,000
3
Beds
2
Baths
2,120
Sq Ft
$427/Sq Ft
Est. Value
About This Home
This home is located at 7312 Vanalden Ave, Reseda, CA 91335 and is currently estimated at $904,504, approximately $426 per square foot. 7312 Vanalden Ave is a home located in Los Angeles County with nearby schools including Reseda Elementary School, John A. Sutter Middle School, and Northridge Middle School.
Ownership History
Date
Name
Owned For
Owner Type
Purchase Details
Closed on
Jun 16, 2010
Sold by
Babudzhyan Gevork
Bought by
Babudzhyan Gevork and Aleksyan Sona
Current Estimated Value
Purchase Details
Closed on
Feb 17, 2001
Sold by
Grigorian Sirvard
Bought by
Babudzhyan Gevork
Purchase Details
Closed on
Mar 3, 1998
Sold by
Grigorian Grigor
Bought by
Grigorian Sirvard
Home Financials for this Owner
Home Financials are based on the most recent Mortgage that was taken out on this home.
Original Mortgage
$119,000
Interest Rate
7.11%
Purchase Details
Closed on
Jan 23, 1998
Sold by
Phh Us Mtg Services
Bought by
Grigorian Sirvard
Home Financials for this Owner
Home Financials are based on the most recent Mortgage that was taken out on this home.
Original Mortgage
$119,000
Interest Rate
7.11%
Purchase Details
Closed on
Jul 30, 1997
Sold by
Edwardsen Mary A
Bought by
Bankers Trust Company
Create a Home Valuation Report for This Property
The Home Valuation Report is an in-depth analysis detailing your home's value as well as a comparison with similar homes in the area
Home Values in the Area
Average Home Value in this Area
Purchase History
| Date | Buyer | Sale Price | Title Company |
|---|---|---|---|
| Babudzhyan Gevork | -- | None Available | |
| Babudzhyan Gevork | -- | Gateway Title Company | |
| Grigorian Sirvard | -- | First American Title Co | |
| Grigorian Sirvard | $170,000 | First American Title Co | |
| Bankers Trust Company | $225,203 | United Independent Title Ins |
Source: Public Records
Mortgage History
| Date | Status | Borrower | Loan Amount |
|---|---|---|---|
| Previous Owner | Grigorian Sirvard | $119,000 |
Source: Public Records
Tax History
| Year | Tax Paid | Tax Assessment Tax Assessment Total Assessment is a certain percentage of the fair market value that is determined by local assessors to be the total taxable value of land and additions on the property. | Land | Improvement |
|---|---|---|---|---|
| 2025 | $5,184 | $414,362 | $263,689 | $150,673 |
| 2024 | $5,184 | $406,238 | $258,519 | $147,719 |
| 2023 | $5,087 | $398,273 | $253,450 | $144,823 |
| 2022 | $4,857 | $390,465 | $248,481 | $141,984 |
| 2021 | $4,788 | $382,809 | $243,609 | $139,200 |
| 2019 | $4,648 | $371,457 | $236,385 | $135,072 |
| 2018 | $4,500 | $364,174 | $231,750 | $132,424 |
| 2016 | $4,281 | $350,034 | $222,751 | $127,283 |
| 2015 | $4,219 | $344,778 | $219,406 | $125,372 |
| 2014 | $4,239 | $338,026 | $215,109 | $122,917 |
Source: Public Records
Map
Nearby Homes
- 19034 Wyandotte St
- 7231 Vanalden Ave
- 7326 Vanalden Ave
- 19009 Sherman Way Unit 2
- 19018 Sherman Way Unit 106
- 18958 Sherman Way Unit 19
- 18954 Sherman Way Unit 3
- 19016 Runnymede St
- 7431 Vanalden Ave
- 19230 Wyandotte St Unit 14
- 18985 Gault St Unit 9
- 7459 Vanalden Ave
- 7508 Claire Ave
- 7514 Beckford Ave
- 18813 Cantlay St
- 7535 Vanalden Ave
- 7551 Donna Ave
- 19355 Sherman Way Unit 42
- 19350 Sherman Way Unit 124
- 19350 Sherman Way Unit 210
- 7306 Vanalden Ave
- 7316 Vanalden Ave
- 7300 Vanalden Ave
- 7322 Vanalden Ave
- 19043 Wyandotte St
- 19038 Leadwell St
- 7325 Donna Ave
- 19037 Wyandotte St
- 19034 Leadwell St
- 19046 Wyandotte St
- 7256 Vanalden Ave
- 7330 Vanalden Ave
- 7329 Donna Ave
- 7313 Vanalden Ave
- 19033 Wyandotte St
- 7317 Vanalden Ave
- 7307 Vanalden Ave
- 7323 Vanalden Ave
- 7303 Vanalden Ave
- 7253 Donna Ave
Your Personal Tour Guide
Ask me questions while you tour the home.